
集合2样本t检验中的分组因素
集合2样本t检验中的分组因素
提问于 2020-06-18 17:43:23
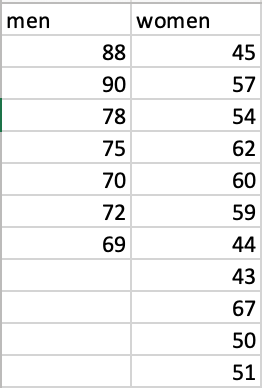
我有一张由7名男性和11名女性组成的2*2表(保存为weights_gender.csv),目的是进行一次综合t检验。我已经将CSV文件指定为weight = read.csv("weights_gender.csv"),但是每当我尝试运行t.test(weight$men~weight$women, var.equal=TRUE)时,它都会继续打印以下消息:
分组因子必须有两个级别。
有什么问题吗?
回答 2
Stack Overflow用户
回答已采纳
发布于 2020-06-18 18:24:06
试着..。
t.test(x = weight$men, y = weight$women, var.equal = TRUE)你指定命令的方式,它认为你想要男人的体重按女人分组,这当然不是你想要的。
结果..。
    Two Sample t-test

data:  weight$men and weight$women
t = 5.9957, df = 16, p-value = 1.867e-05
alternative hypothesis: true difference in means is not equal to 0
95 percent confidence interval:
 15.26250 31.95828
sample estimates:
mean of x mean of y
 77.42857  53.81818
数据
weight <- data.frame(
   men = c(88, 90, 78, 75, 70, 72, 69, NA, NA, NA, NA),
   women = c(45, 57, 54, 62, 60, 59, 44, 43, 67, 50, 51)
)Stack Overflow用户
发布于 2020-06-18 18:25:10
你的问题有点“理论性”,所以我会让它更加具体。
在这里,我用关于男人和女人体重的数据制作了两个数据框架,并给它们贴上标签。
df_m <- tibble(weight = 170 + 30*rnorm(7), sex = "Male")
df_f <- tibble(weight = 130 + 30*rnorm(11), sex = "Female")接下来,我们将数据组合起来,并将sex设置为因子变量。
df_all <- rbind(df_m, df_f)
df_all[, 'sex'] <- lapply(df_all[, 'sex'], as.factor)
最后应用t检验。
t.test(weight ~ sex, data = df_all, var.equal = TRUE)我的结果是
    Two Sample t-test

data:  weight by sex
t = -5.2104, df = 16, p-value = 8.583e-05
alternative hypothesis: true difference in means is not equal to 0
95 percent confidence interval:
 -89.84278 -37.87810
sample estimates:
mean in group Female   mean in group Male
120.2316 184.0921页面原文内容由Stack Overflow提供。腾讯云小微IT领域专用引擎提供翻译支持
原文链接:
https://stackoverflow.com/questions/62456186
复制相关文章
相似问题
腾讯云开发者

Copyright © 2013 - 2026 Tencent Cloud. All Rights Reserved. 腾讯云 版权所有
深圳市腾讯计算机系统有限公司 ICP备案/许可证号:粤B2-20090059 ![]() 粤公网安备44030502008569号
粤公网安备44030502008569号
腾讯云计算(北京)有限责任公司 京ICP证150476号 | 京ICP备11018762号