
插入(shapefile)
插入(shapefile)
提问于 2020-06-20 20:44:58
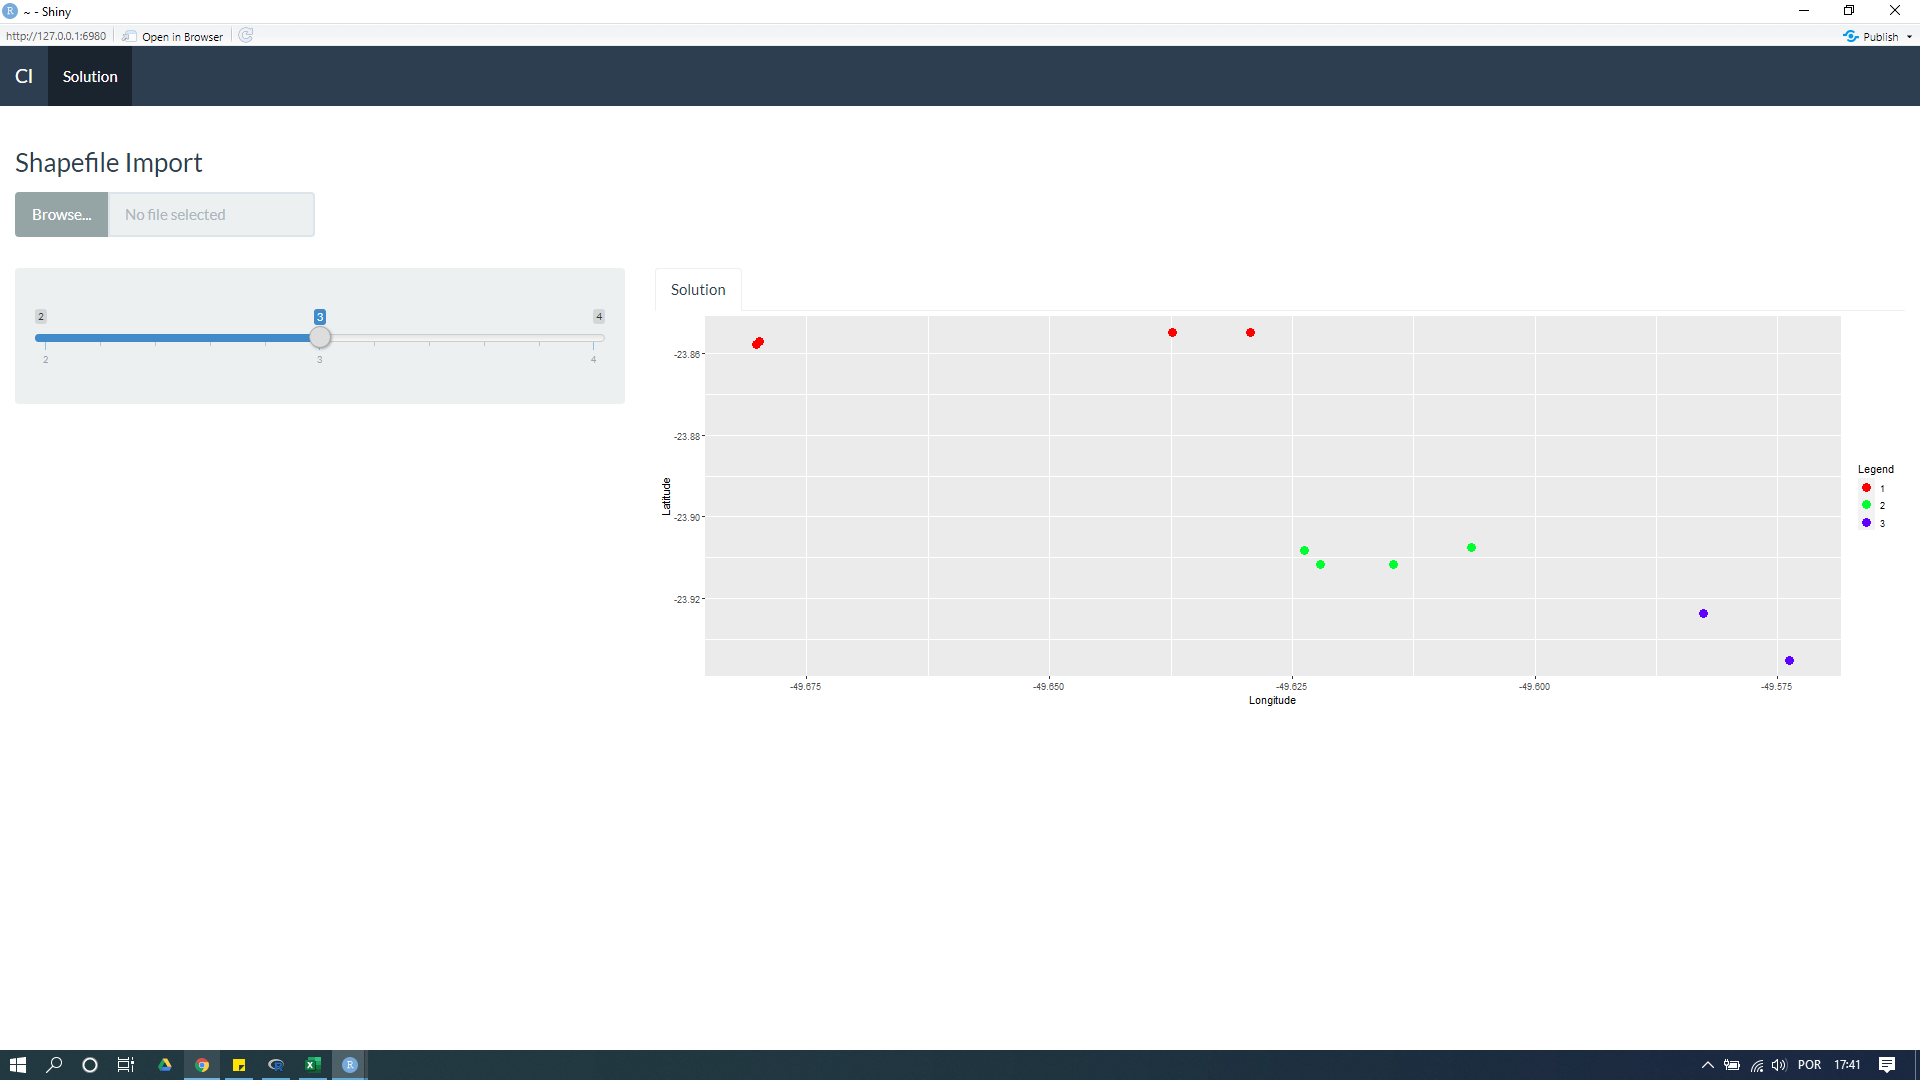
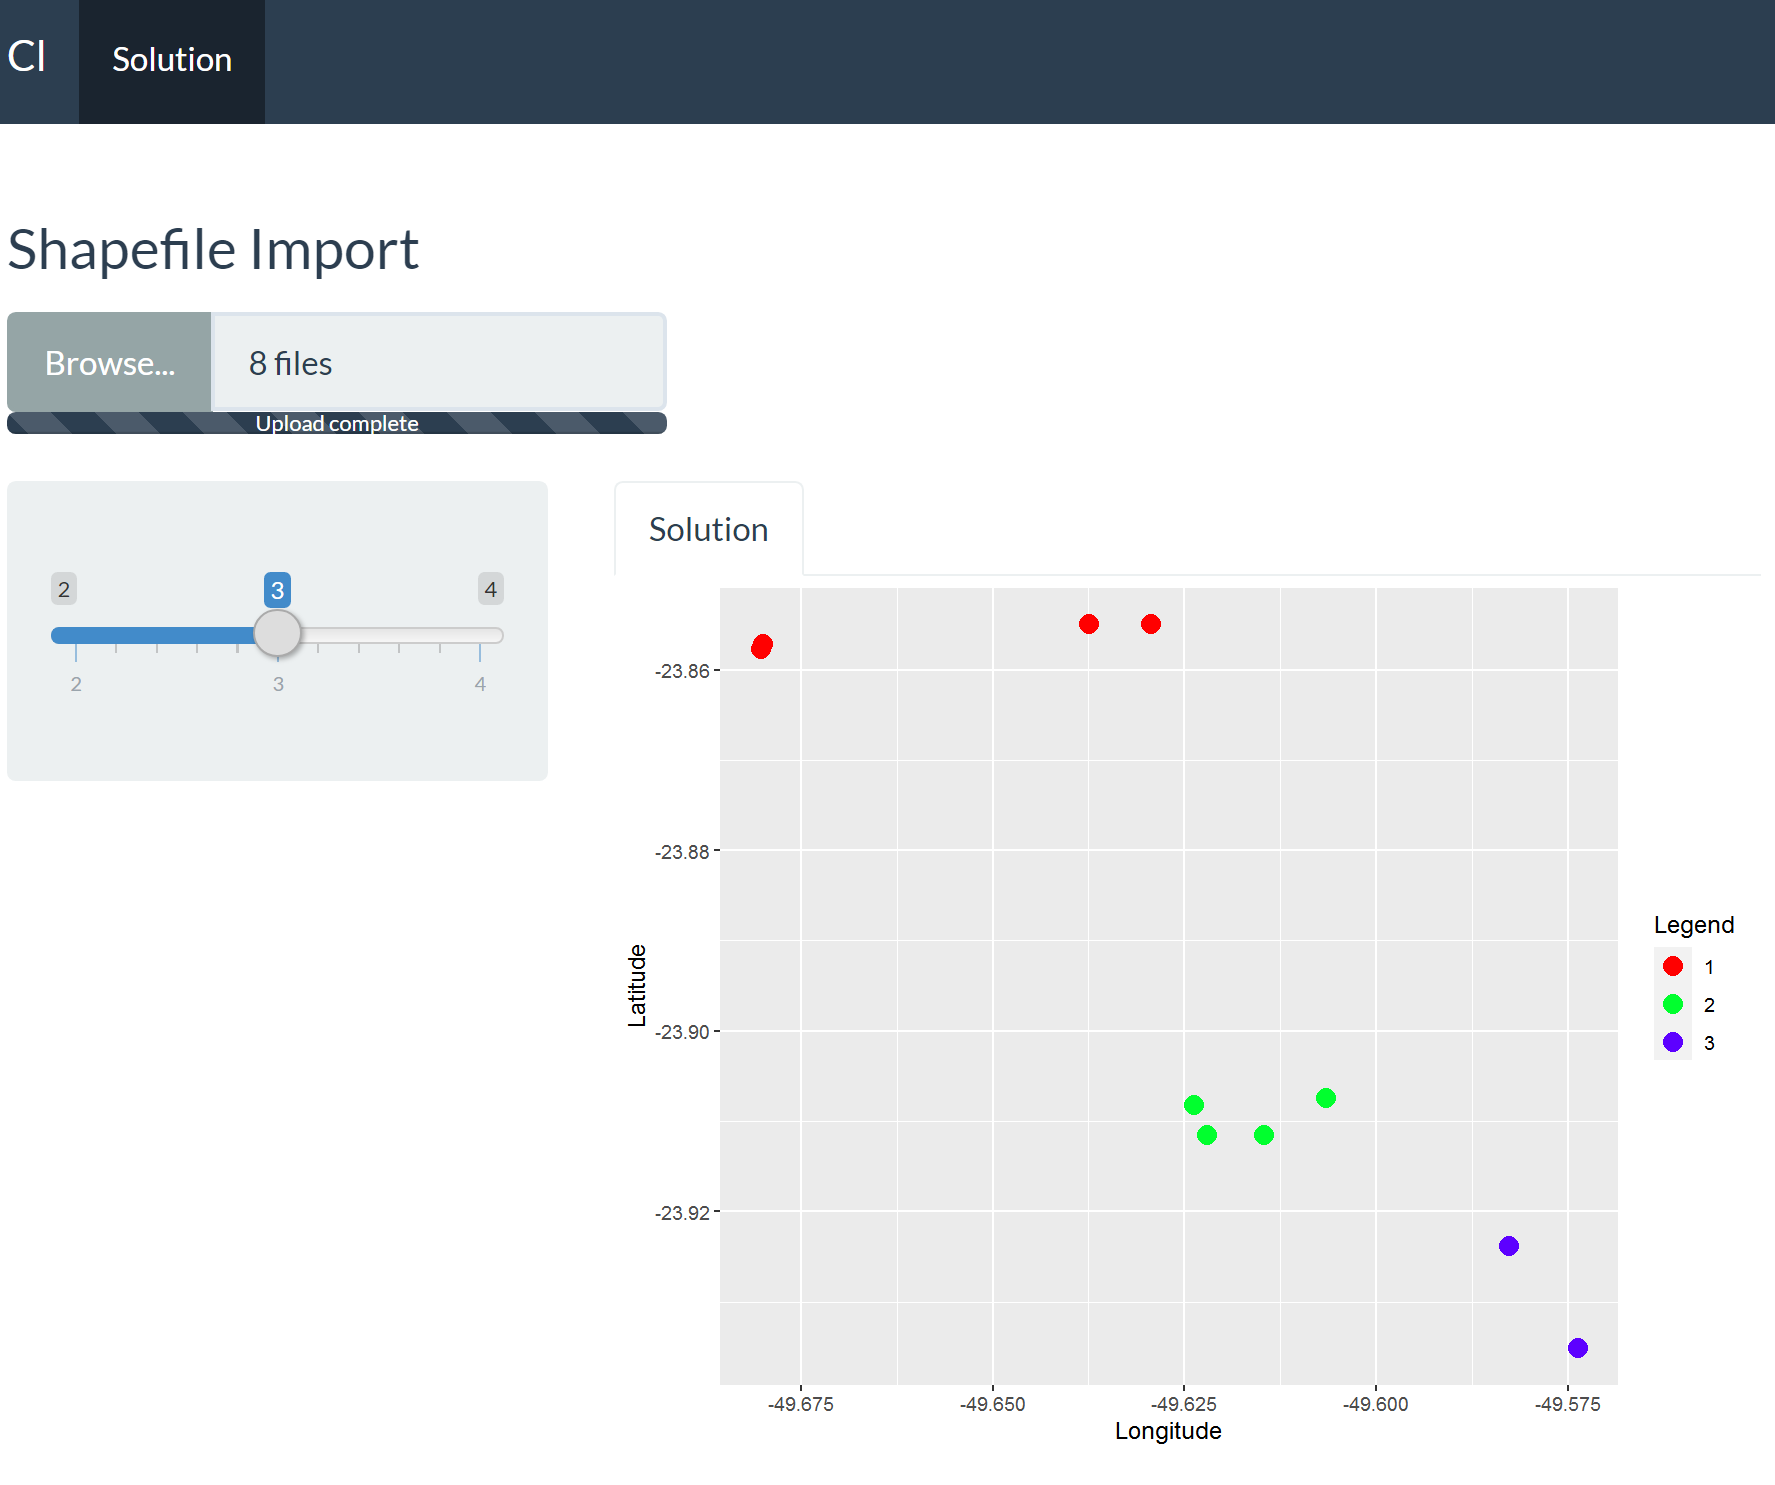
下面的代码是从一个shapefile文件生成一个散点图。它是正常生成的(见附图)。但是,我不想直接将文件目录插入到代码中,而是通过一个fileInput插入文件。我在下面插入了fileInput,但是我希望帮助调整我的服务器。我认为有必要调整一些与反应有关的东西。
非常感谢!
library(shiny)
library(ggplot2)
library(shinythemes)
library(rdist)
library(geosphere)
library(rgdal)

function.cl<-function(df,k){

  shape<-readOGR(dsn="C:/Users/Jose Souza/Documents/Test",layer="Export_Output_3")
  df<-shape@data

  #clusters
  coordinates<-df[c("Latitude","Longitude")]
  d<-as.dist(distm(coordinates[,2:1]))
  fit.average<-hclust(d,method="average")
  clusters<-cutree(fit.average, k)
  nclusters<-matrix(table(clusters))
  df$cluster <- clusters

  #all cluster data df1 and specific cluster df_spec_clust
  df1<-df[c("Latitude","Longitude")]
  df1$cluster<-as.factor(clusters)

  #Colors
  my_colors <- rainbow(length(df1$cluster))
  names(my_colors) <- df1$cluster

  #Scatter Plot for all clusters
  g <- ggplot(data = df1,  aes(x=Longitude, y=Latitude, color=cluster)) +
    geom_point(aes(x=Longitude, y=Latitude), size = 4) +
    scale_color_manual("Legend", values = my_colors)
  plotGD <- g


  return(list(
    "Plot" = plotGD
  ))
}

ui <- bootstrapPage(
  navbarPage(theme = shinytheme("flatly"), collapsible = TRUE,
             "Cl",
             tabPanel("Solution",
                      fileInput("shp", h3("Shapefile Import"), multiple = TRUE, accept = c('.shp', '.dbf','.sbn', '.sbx', '.shx', '.prj')),
                      sidebarLayout(
                        sidebarPanel(

                          sliderInput("Slider", h5(""),
                                      min = 2, max = 4, value = 3),
                        ),
                        mainPanel(
                          tabsetPanel(
                            tabPanel("Solution", plotOutput("ScatterPlot"))))

                      ))))

server <- function(input, output, session) {

  Modelcl<-reactive({
    function.cl(df,input$Slider)
  })

  output$ScatterPlot <- renderPlot({
    Modelcl()[[1]]
  })

}

shinyApp(ui = ui, server = server)
回答 1
Stack Overflow用户
回答已采纳
发布于 2020-06-20 21:56:23
- 向function.cl添加一个新的
path参数,删除未使用的df参数,因为在服务器:
中直接分配的函数
- 中使用的是“事件反应”
  Modelcl <- eventReactive(input$shp,{
    req(input$shp)
    mydir <- tempdir()
    on.exit(unlink(mydir))
    print(paste("names:",input$shp$name))
    file.copy(input$shp$datapath,file.path(mydir, input$shp$name) )
    function.cl(input$Slider,mydir)

})困难在于readOGR需要路径,但fileInput返回文件。
解决方法是创建一个临时目录以获取路径(服务器上的),将fileInput文件复制到其中,并将该临时目录的路径提供给readOGR以供进一步处理。
这适用于您提供的示例文件:
library(shiny)
library(ggplot2)
library(shinythemes)
library(rdist)
library(geosphere)
library(rgdal)

function.cl<-function(k,path,filename){
  print(dir(path))
  shape<-readOGR(dsn=path,layer=filename)
  df<-shape@data

  #clusters
  coordinates<-df[c("Latitude","Longitude")]
  d<-as.dist(distm(coordinates[,2:1]))
  fit.average<-hclust(d,method="average")
  clusters<-cutree(fit.average, k)
  nclusters<-matrix(table(clusters))
  df$cluster <- clusters

  #all cluster data df1 and specific cluster df_spec_clust
  df1<-df[c("Latitude","Longitude")]
  df1$cluster<-as.factor(clusters)

  #Colors
  my_colors <- rainbow(length(df1$cluster))
  names(my_colors) <- df1$cluster

  #Scatter Plot for all clusters
  g <- ggplot(data = df1,  aes(x=Longitude, y=Latitude, color=cluster)) +
    geom_point(aes(x=Longitude, y=Latitude), size = 4) +
    scale_color_manual("Legend", values = my_colors)
  plotGD <- g


  return(list(
    "Plot" = plotGD
  ))
}

ui <- bootstrapPage(
  navbarPage(theme = shinytheme("flatly"), collapsible = TRUE,
             "Cl",
             tabPanel("Solution",
                      fileInput("shp", h3("Shapefile Import"), multiple = TRUE, accept = c('.shp', '.dbf','.sbn', '.sbx', '.shx', '.prj')),
                      sidebarLayout(
                        sidebarPanel(

                          sliderInput("Slider", h5(""),
                                      min = 2, max = 4, value = 3),
                        ),
                        mainPanel(
                          tabsetPanel(
                            tabPanel("Solution", plotOutput("ScatterPlot"))))

                      ))))

server <- function(input, output, session) {

  # Modelcl<-reactive({
  #   function.cl(df,input$Slider,input$Filter1)
  # })
  Modelcl <- eventReactive(c(input$shp, input$Slider),{
    req(input$shp)
    tmpdir <- tempdir()
    on.exit(unlink(tmpdir))
    filename <- substr(input$shp$name[1],1,nchar(input$shp$name[1])-4)
    file.copy(input$shp$datapath,file.path(tmpdir,input$shp$name) )
    function.cl(input$Slider,tmpdir,filename)

  })

  output$ScatterPlot <- renderPlot({
    Modelcl()[[1]]
  })

  observeEvent(input$Slider, {
    abc <- req(Modelcl()$Data)
    updateSelectInput(session,'Filter1',
                      choices=sort(unique(abc$cluster)))
  })

}

shinyApp(ui = ui, server = server)
页面原文内容由Stack Overflow提供。腾讯云小微IT领域专用引擎提供翻译支持
原文链接:
https://stackoverflow.com/questions/62491453
复制相关文章
相似问题
腾讯云开发者

Copyright © 2013 - 2026 Tencent Cloud. All Rights Reserved. 腾讯云 版权所有
深圳市腾讯计算机系统有限公司 ICP备案/许可证号:粤B2-20090059 ![]() 粤公网安备44030502008569号
粤公网安备44030502008569号
腾讯云计算(北京)有限责任公司 京ICP证150476号 | 京ICP备11018762号