
通过选择散点图上的点更新破折号表
通过选择散点图上的点更新破折号表
提问于 2020-06-22 14:19:31
我在做一个仪表板。这是我的代码:
# IMPORT SECTION
import dash
import dash_table
import dash_core_components as dcc
import dash_html_components as html
import dash_bootstrap_components as dbc
from dash.dependencies import Input, Output
import plotly.graph_objs as go
import numpy as np
import pandas as pd
from math import ceil
from matplotlib.cm import Set3


# INPUT DATA
n = 7
d_min = 0.2
d_max = 0.8
d_step = 0.1
N_min = 2000
N_max = 8000
N_step = 1000
D = 40
h = 20
dataframe_file = 'data.xlsx'


# COLOR AND FONT DEFINITION
grey = '#e0e1f5'
black = '#212121'
scatter_colors = ['#' + ''.join(['{:02x}'.format(int(255*Set3(i)[j])) for j in range(3)]) for i in range(n)]
fontsize = 18
fontfamily = 'Arial, sans-serif'


# READ CSV DATA
df = pd.read_excel(dataframe_file)


# CREATE DATA FOR DASH DATATABLE
df_scatter_colors = ceil(len(df) / len(scatter_colors)) * scatter_colors
df_scatter_colors = df_scatter_colors[:len(df)]
df.insert(loc = 0, column = 'COLOR', value = df_scatter_colors)

headers = [{"name": i, "id": i} for i in df.columns]

table = df.to_dict('records')

table_colors = [{'if': {'row_index': i, 'column_id': 'COLOR'},
                 'background-color': df.iloc[i]['COLOR'],
                 'color': df.iloc[i]['COLOR']} for i in range(df.shape[0])]


# CREATE DATA AND LAYOUT FOR THE SCATTERPLOT
x_jitter = 0.05 * N_step * np.random.randn(len(df))
y_jitter = 0.05 * d_step * 1000 * np.random.randn(len(df))
data = [go.Scatter(x = df['NUMBER'] + x_jitter,
                   y = df['DIAMETER'] + y_jitter,
                   text = df['PRODUCT'],
                   mode = 'markers',
                   hoverinfo = 'skip',
                   showlegend = False,
                   marker_color = 'rgba(0, 0, 0, 0)',
                   marker = {'size': 25,
                             'line': {'color': df['COLOR'],
                                      'width': 8}})]

layout = go.Layout(plot_bgcolor = black,
                   hovermode = 'x unified',
                   uirevision = 'value')

figure = go.Figure(data = data, layout = layout)


# DASHBOARD LAYOUT
app = dash.Dash(external_stylesheets = [dbc.themes.BOOTSTRAP])

app.layout = html.Div(id = 'general_div',
                      children = [html.Div(id = 'first_row',
                                           children = [dcc.Graph(id = 'main_graph',
                                                                 figure = figure,
                                                                 style = {'height': 800,
                                                                          'width': 1400})],

                                           className = 'row'),

                                  html.Div(id = 'second_row',
                                           children = [dash_table.DataTable(id = 'main_table',
                                                                            columns = headers,
                                                                            data = table,
                                                                            style_data_conditional = table_colors,
                                                                            style_table = {'margin-left': '3vw',
                                                                                           'margin-top': '3vw'},
                                                                            style_cell = {'font-family': fontfamily,
                                                                                          'fontSize': fontsize},
                                                                            style_header = {'backgroundColor': 'rgb(230, 230, 230)',
                                                                                            'fontWeight': 'bold'})],

                                           className = 'row')])


# CALLBACK DEFINITION
@app.callback(Output('main_table', 'style_data_conditional'),
              [Input('main_graph', 'selectedData'),
               Input('main_table', 'style_data_conditional')])
def display_selected_data(selectedData, style_data_conditional):
    # what to do here and how to run this callback?
    return style_data_conditional


if __name__ == "__main__":
app.run_server()仪表板中有一个散点图(dcc.Graph)和一个表(dash_table.DataTable)。散点图的每个点对应于表中的特定行,我从excel文件中读取这些数据。
excel文件中的数据采用以下格式:
PRODUCT CODE    NUMBER  DIAMETER
AAAAA   1412    8000    0.049
BBBBB   1418    3900    0.08
CCCCC   1420    7600    0.06
DDDDD   1426    8500    0.049
EEEEE   1430    3900    0.08
FFFFF   1442    3900    0.08
GGGGG   1490    8500    0.049
HHHHH   1504    9000    0.18
IIIII   1514    5500    0.224
JJJJJ   1584    7600    0.06
KKKKK   1606    8500    0.049
LLLLL   1618    7600    0.06
MMMMM   1638    7600    0.06
NNNNN   1640    7600    0.06
OOOOO   1666    3900    0.08
PPPPP   1670    8000    0.049
QQQQQ   1672    8000    0.049
RRRRR   1674    7600    0.06
SSSSS   1700    7100    0.071
TTTTT   1704    8500    0.049
UUUUU   1712    7600    0.06
VVVVV   1718    7600    0.06
WWWWW 1722 8000 0.065我想要实现这个函数:当用户选择散点图中的某个点时,代码会高亮显示表中相应的行(例如,将这些行中的单元格的背景色更改为'pink',除了保留颜色的'COLOR'列外)。
检查了这些资料来源:
- dash-datatable-individual-highlight-using-style-data-conditionals-works-unusual
- dash-datatable-style-data-conditional-row-vice
- 交互式图形化
我试图像这样勾勒一个回调,但没有成功:
@app.callback(Output('selected_data', 'children'),
              [Input('main_graph', 'selectedData'),
               Input('main_table', 'style_data_conditional')])
def display_selected_data(selectedData, style_data_conditional):
    selected_points = []
    for point in selectedData['points']:
        selected_points.append(point['marker.line.color'])
    selected = [{'if': {'filter': '{COLOR} eq ' + f'"{color}"',
                        'column_id': 'PRODUCT'},
                 'backgroundColor': 'pink'} for color in selected_points]
    style_data_conditional.extend(selected)

    return style_data_conditional
提前谢谢。
版本信息
Python                       3.7.0
dash                         1.12.0
dash-bootstrap-components    0.10.1
dash-core-components         1.10.0
dash-html-components         1.0.3
matplotlib                   3.0.2
numpy                        1.15.4
plotly 4.7.0回答 1
Stack Overflow用户
回答已采纳
发布于 2020-06-23 08:43:16
我以selectedData作为来自main_graph的输入,通过函数update_table_style处理main_table的style_data_conditional作为输出,从而解决了这个问题。
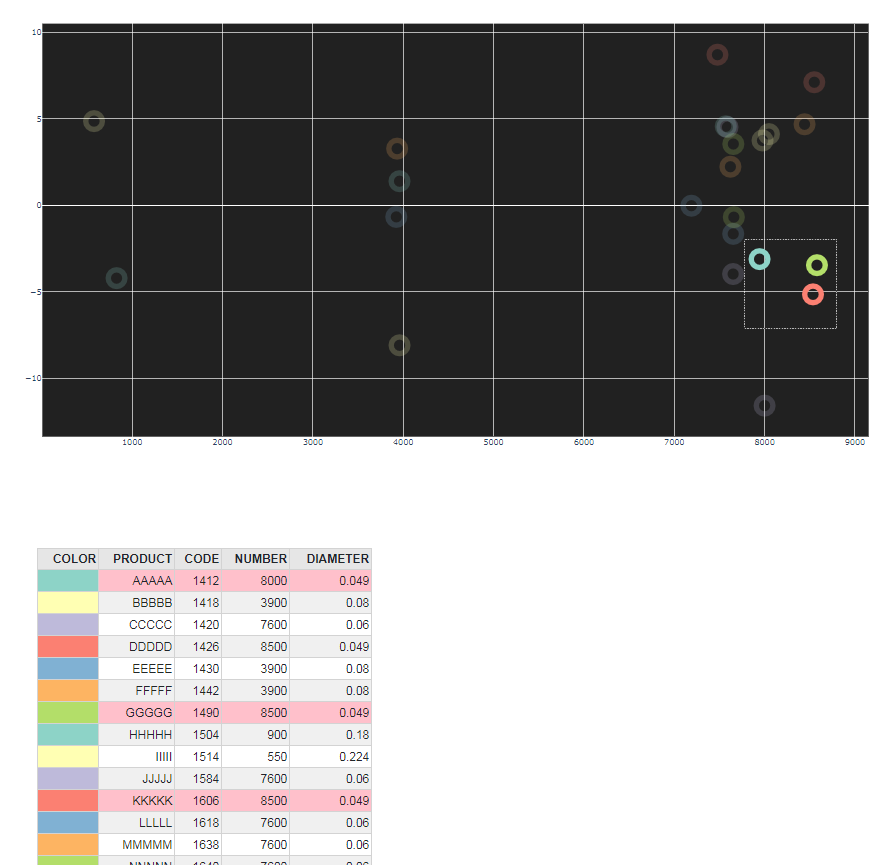
这里我用深灰色的奇数行着色,以提高表的可见性,然后通过样式条件设置选定行的背景色。最后,我根据每一行的颜色更改第一列的背景(每一行的第一列所报告的颜色)。
代码:
# IMPORT SECTION
import dash
import dash_table
import dash_core_components as dcc
import dash_html_components as html
import dash_bootstrap_components as dbc
from dash.dependencies import Input, Output
import plotly.graph_objs as go
import numpy as np
import pandas as pd
from math import ceil
from matplotlib.cm import Set3


# INPUT DATA
n = 7
d_min = 0.2
d_max = 0.8
d_step = 0.1
N_min = 2000
N_max = 8000
N_step = 1000
D = 40
h = 20
dataframe_file = 'data.xlsx'


# COLOR AND FONT DEFINITION
grey = '#e0e1f5'
black = '#212121'
scatter_colors = ['#' + ''.join(['{:02x}'.format(int(255*Set3(i)[j])) for j in range(3)]) for i in range(n)]
fontsize = 18
fontfamily = 'Arial, sans-serif'


# READ CSV DATA
df = pd.read_excel(dataframe_file)


# CREATE DATA FOR DASH DATATABLE
df_scatter_colors = ceil(len(df) / len(scatter_colors)) * scatter_colors
df_scatter_colors = df_scatter_colors[:len(df)]
df.insert(loc = 0, column = 'COLOR', value = df_scatter_colors)

headers = [{"name": i, "id": i} for i in df.columns]

table = df.to_dict('records')


# CREATE DATA AND LAYOUT FOR THE SCATTERPLOT
x_jitter = 0.05 * N_step * np.random.randn(len(df))
y_jitter = 0.05 * d_step * 1000 * np.random.randn(len(df))
data = [go.Scatter(x = df['NUMBER'] + x_jitter,
                   y = df['DIAMETER'] + y_jitter,
                   text = df['PRODUCT'],
                   mode = 'markers',
                   hoverinfo = 'skip',
                   showlegend = False,
                   marker_color = 'rgba(0, 0, 0, 0)',
                   marker = {'size': 25,
                             'line': {'color': df['COLOR'],
                                      'width': 8}})]

layout = go.Layout(plot_bgcolor = black,
                   hovermode = 'x unified',
                   uirevision = 'value')

figure = go.Figure(data = data, layout = layout)

def update_table_style(selectedData):
    table_style_conditions = [{'if': {'row_index': 'odd'},
                               'backgroundColor': 'rgb(240, 240, 240)'}]

    if selectedData != None:
        points_selected = []
        for point in selectedData['points']:
            points_selected.append(point['pointIndex'])
        selected_styles = [{'if': {'row_index': i},
                            'backgroundColor': 'pink'} for i in points_selected]
        table_style_conditions.extend(selected_styles)

    table_style_conditions.extend([{'if': {'row_index': i, 'column_id': 'COLOR'},
                                    'background-color': df.iloc[i]['COLOR'],
                                    'color': df.iloc[i]['COLOR']} for i in range(df.shape[0])])

    return table_style_conditions


# DASHBOARD LAYOUT
app = dash.Dash(external_stylesheets = [dbc.themes.BOOTSTRAP])

app.layout = html.Div(id = 'general_div',
                      children = [html.Div(id = 'first_row',
                                           children = [dcc.Graph(id = 'main_graph',
                                                                 figure = figure,
                                                                 style = {'height': 800,
                                                                          'width': 1400})],

                                           className = 'row'),

                                  html.Div(id = 'second_row',
                                           children = [dash_table.DataTable(id = 'main_table',
                                                                            columns = headers,
                                                                            data = table,
                                                                            # style_data_conditional = table_colors,
                                                                            style_table = {'margin-left': '3vw',
                                                                                           'margin-top': '3vw'},
                                                                            style_cell = {'font-family': fontfamily,
                                                                                          'fontSize': fontsize},
                                                                            style_header = {'backgroundColor': 'rgb(230, 230, 230)',
                                                                                            'fontWeight': 'bold'})],

                                           className = 'row')])


# CALLBACK DEFINITION
@app.callback(Output('main_table', 'style_data_conditional'),
              [Input('main_graph', 'selectedData')])
def display_selected_data(selectedData):
    table_style_conditions = update_table_style(selectedData)
    return table_style_conditions


if __name__ == "__main__":
    app.run_server()
着色部分如下:
table_style_conditions = [{'if': {'row_index': 'odd'},
                           'backgroundColor': 'rgb(240, 240, 240)'}]

if selectedData != None:
    points_selected = []
    for point in selectedData['points']:
        points_selected.append(point['pointIndex'])
    selected_styles = [{'if': {'row_index': i},
                        'backgroundColor': 'pink'} for i in points_selected]
    table_style_conditions.extend(selected_styles)

table_style_conditions.extend([{'if': {'row_index': i, 'column_id': 'COLOR'},
                                'background-color': df.iloc[i]['COLOR'],
                                'color': df.iloc[i]['COLOR']} for i in range(df.shape[0])])
这是我得到的结果:
页面原文内容由Stack Overflow提供。腾讯云小微IT领域专用引擎提供翻译支持
原文链接:
https://stackoverflow.com/questions/62516573
复制相关文章
相似问题
腾讯云开发者

Copyright © 2013 - 2026 Tencent Cloud. All Rights Reserved. 腾讯云 版权所有
深圳市腾讯计算机系统有限公司 ICP备案/许可证号:粤B2-20090059 ![]() 粤公网安备44030502008569号
粤公网安备44030502008569号
腾讯云计算(北京)有限责任公司 京ICP证150476号 | 京ICP备11018762号