
通过获取正确格式的Google数据,使用matplotlib同时显示多个多边形
通过获取正确格式的Google数据,使用matplotlib同时显示多个多边形
提问于 2020-06-24 18:01:45
我的目标是同时显示多个多边形(这是我从获得的数据)。
我有一个以这种格式列出的坐标:
lst_coord = [['(742,335),(840,334),(840,351),(742,352)'], ['(304,1416),(502,1415),(502,1448),(304,1449)']知道这些是字符串:
(742,548),(814,549),(814,563),(742,562)
<class 'str'>import matplotlib.pyplot as plt
def plotpoly(coord,x,y):
coord.append(coord[0])
x, y = zip(*coord)
plt.plot(x,y)
for coord in lst_coord:
plotpoly(coord,x,y)
plt.show() 我得到了一个错误:
AttributeError: 'str' object has no attribute 'append'我尝试过很多不同的东西。但我不能让它起作用..。
奖励:我的最终目标是在图片上显示这些多边形,而我也在与此斗争.
回答 1
Stack Overflow用户
回答已采纳
发布于 2020-06-24 18:29:12
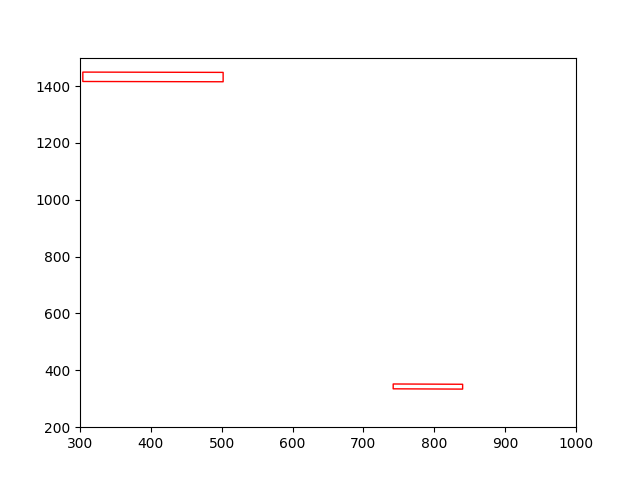
您可以使用Polygon修补程序,它们将自动关闭:
import matplotlib.pyplot as plt
from matplotlib.patches import Polygon
from matplotlib.collections import PatchCollection

lst_coord = [['(742,335),(840,334),(840,351),(742,352)'], ['(304,1416),(502,1415),(502,1448),(304,1449)']]
patches = []
for coord in lst_coord:
    patches.append(Polygon(eval(coord[0])))

fig, ax = plt.subplots()
ax.add_collection(PatchCollection(patches, fc='none', ec='red'))
ax.set_xlim(0,1000)
ax.set_ylim(0,1500)
plt.show()
页面原文内容由Stack Overflow提供。腾讯云小微IT领域专用引擎提供翻译支持
原文链接:
https://stackoverflow.com/questions/62561329
复制相关文章
相似问题
腾讯云开发者

Copyright © 2013 - 2026 Tencent Cloud. All Rights Reserved. 腾讯云 版权所有
深圳市腾讯计算机系统有限公司 ICP备案/许可证号:粤B2-20090059 ![]() 粤公网安备44030502008569号
粤公网安备44030502008569号
腾讯云计算(北京)有限责任公司 京ICP证150476号 | 京ICP备11018762号