
根据dplyr的条件从存在的列中计算值
根据dplyr的条件从存在的列中计算值
提问于 2020-07-04 11:50:08
我有一个数据集,列有“性别”和“经济”,其中有以下意见:
  gender  economy
1    Male      Bad
2  Female      Bad
3  Female      Bad
4    Male      Bad
5    Male     Good
6    Male      Bad
7    Male Very bad
8    Male Very bad
9    Male Very bad
10   Male Very bad
11 Female      Bad
12   Male     Good
13   Male     Good
14 Female     Good
15   Male      Bad
16 Female     Good
17 Female Very bad
18   Male Very bad
19 Female     Good
20 Female      Bad

structure(list(gender = structure(c(2L, 1L, 1L, 2L, 2L, 2L, 2L,
2L, 2L, 2L, 1L, 2L, 2L, 1L, 2L, 1L, 1L, 2L, 1L, 1L), .Label = c("Female",
"Male"), class = "factor"), economy = structure(c(3L, 3L, 3L,
3L, 2L, 3L, 4L, 4L, 4L, 4L, 3L, 2L, 2L, 2L, 3L, 2L, 4L, 4L, 2L,
3L), .Label = c("Very good", "Good", "Bad", "Very bad", "Don't know"
), class = "factor")), row.names = c(NA, 20L), class = "data.frame")
我现在想计算的是,女性和男性的比例,以及被调查者认为经济状况不好或非常糟糕的总和。我可以在R之外手动计算,但我想知道一种快速的方法在R内计算,我知道如何计算股票,但现在我被困住了:
lebanon %>%
  group_by(gender) %>%
  filter(!is.na(economy), economy != "Don't know") %>%
  count(economy) %>%
  mutate(prop = n / sum(n) * 100)

  gender economy       n   prop
  <fct>  <fct>     <int>  <dbl>
1 Female Very good     7  0.586
2 Female Good        146 12.2
3 Female Bad         544 45.6
4 Female Very bad    497 41.6
5 Male   Very good     5  0.417
6 Male   Good        161 13.4
7 Male   Bad         515 42.9
8 Male   Very bad    519 43.2
问候
回答 2
Stack Overflow用户
回答已采纳
发布于 2020-07-04 12:31:02
从初始的lebanon数据框架开始(我能够使用uncount从汇总表中恢复它),并尝试这段代码,它使用forcats::fct_collapse组合所需的因子级别。
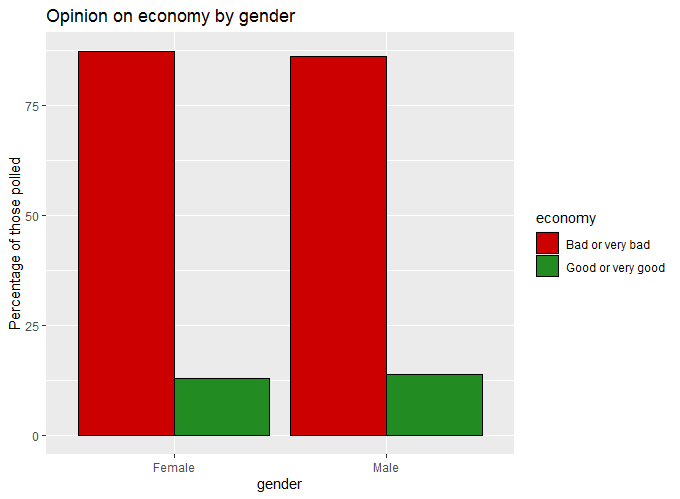
为了完整起见,我在结尾处包含了一个简单的at图。
library(forcats)
library(dplyr)
library(tidyr)
library(ggplot2)

df <- lebanon %>%
  group_by(gender) %>%
  filter(!is.na(economy), economy != "Don't know") %>%
  mutate(economy = fct_collapse(economy,
                   `Bad or very bad` = c("Bad", "Very bad"),
                   `Good or very good` = c("Good", "Very good"))
         ) %>%
  count(economy) %>%
  mutate(prop = n / sum(n) * 100)

df
#> # A tibble: 4 x 4
#> # Groups:   gender [2]
#>   gender economy               n  prop
#>   <fct>  <fct>             <int> <dbl>
#> 1 Female Bad or very bad    1041  87.2
#> 2 Female Good or very good   153  12.8
#> 3 Male   Bad or very bad    1034  86.2
#> 4 Male   Good or very good   166  13.8

ggplot(df, aes(x = gender, y = prop, fill = economy)) +
  geom_col(position = "dodge", color = "black") +
  scale_fill_manual(values = c("red3", "forestgreen")) +
  labs(title = "Opinion on economy by gender", y = "Percentage of those polled")
Stack Overflow用户
发布于 2020-07-04 12:22:27
这可能会有帮助:
library(dplyr)

lebanon %>%
  mutate(type = ifelse(grepl('Good', economy, ignore.case = TRUE), 'Good', 'Bad')) %>%
  count(gender, type)

#  gender type n
#1 Female  Bad 5
#2 Female Good 3
#3   Male  Bad 9
#4 Male Good 3这使"Good/Very Good"在一种类型中,"Bad/Very Bad"在另一种类型中。
页面原文内容由Stack Overflow提供。腾讯云小微IT领域专用引擎提供翻译支持
原文链接:
https://stackoverflow.com/questions/62728745
复制相关文章
相似问题
腾讯云开发者

Copyright © 2013 - 2026 Tencent Cloud. All Rights Reserved. 腾讯云 版权所有
深圳市腾讯计算机系统有限公司 ICP备案/许可证号:粤B2-20090059 ![]() 粤公网安备44030502008569号
粤公网安备44030502008569号
腾讯云计算(北京)有限责任公司 京ICP证150476号 | 京ICP备11018762号