
如何在python中创建图形后更改散射的轴限值
我想要创建一个NFL字段的小区,然后在其上放置一个散点图。这是我的字段代码(只需复制粘贴所有这些。这不是我的问题所在):
import matplotlib.pyplot as plt
import pylab as pl


# Create figure
fig, ax = pl.subplots(figsize=(15,10))

# Set field dimensions
plt.xlim(0, 120)  # Field length including endzones
plt.ylim(0, 53.3)  # field width

# Set field color green
ax.set_facecolor('#79af75')
ax.set_alpha(0.5)

# Print lines
for i in range(0, 120, 10):
    plt.axvline(i, color='white', linewidth=3, alpha=0.4, zorder=1)
    if i == 10 or i == 110:  # Make endzone lines
        plt.axvline(i, color='white', linewidth=5, alpha=0.4, zorder=1)

# Paint numbers
yds_from_sideline = 12
for i in range(10, 50, 10):
    plt.text(i+10, 53.3-yds_from_sideline, str(i), color='white', fontsize=20, verticalalignment='bottom', horizontalalignment='center', rotation=180)
    plt.text(110-i, 53.3-yds_from_sideline,  str(i), color='white', fontsize=20, verticalalignment='bottom', horizontalalignment='center', rotation=180)

    plt.text(i+10, yds_from_sideline, str(i), color='white', fontsize=20, verticalalignment='bottom', horizontalalignment='center')
    plt.text(110-i, yds_from_sideline, str(i), color='white', fontsize=20, verticalalignment='bottom', horizontalalignment='center')

# Paint 50 yard line numbers
plt.text(60, 53.3-yds_from_sideline, str(50), color='white', fontsize=20, verticalalignment='bottom', horizontalalignment='center', rotation=180)
plt.text(60, yds_from_sideline, str(50), color='white', fontsize=20, verticalalignment='bottom', horizontalalignment='center')

# Print something in the endzones

plt.text(5, 26.5, 'Vikings', color='#4F2683', fontsize=30, verticalalignment='center', horizontalalignment='center', rotation=90)
plt.text(115, 26.5, 'Opponent', color='black', fontsize=30, verticalalignment='center', horizontalalignment='center', rotation=270)


# Fix the aspect ratio (optional)
plt.gca().set_aspect(1)

# Display the figure
plt.show()
如果你运行这个,它应该会工作的很好!现在,我有了我想要绘制的数据集。下面是其中的一个例子:
data

  posteam   yardline_100    epa
0   MIN         1.0       0.343304
1   MIN         2.0       0.340690
2   MIN         3.0       0.128643
3   MIN         4.0       0.747664
4   MIN         5.0      -0.190321
5   MIN         6.0       0.265953
6   MIN         7.0      -0.362923
7   MIN         8.0      -0.684526
8   MIN         9.0      -0.107560
9   MIN         10.0      0.263269
10  MIN         11.0     -0.042605
11  MIN         12.0      0.126719
12  MIN         13.0     -0.531782
13  MIN         14.0     -0.329170
14  MIN         15.0      0.608268
我试图将以下代码添加到字段图中,但没有成功。
添加的代码:
plt.title('The gridiron', fontsize=14)
plt.ylabel('EPA', fontsize=12)
plt.xlabel('Yardline', fontsize=12)

ax.set_yticks(np.arange(-5, 6,1))

ax.scatter(x='yardline_100',y='epa',data=data)
整件事和产出:
# Create figure
fig, ax = pl.subplots(figsize=(15,10))

# Set field dimensions
plt.xlim(0, 120)  # Field length including endzones
plt.ylim(0, 53.3)  # field width

# Set field color green
ax.set_facecolor('#79af75')
ax.set_alpha(0.5)

# Print lines
for i in range(0, 120, 10):
    plt.axvline(i, color='white', linewidth=3, alpha=0.4, zorder=1)
    if i == 10 or i == 110:  # Make endzone lines
        plt.axvline(i, color='white', linewidth=5, alpha=0.4, zorder=1)

# Paint numbers
yds_from_sideline = 12
for i in range(10, 50, 10):
    plt.text(i+10, 53.3-yds_from_sideline, str(i), color='white', fontsize=20, verticalalignment='bottom', horizontalalignment='center', rotation=180)
    plt.text(110-i, 53.3-yds_from_sideline,  str(i), color='white', fontsize=20, verticalalignment='bottom', horizontalalignment='center', rotation=180)

    plt.text(i+10, yds_from_sideline, str(i), color='white', fontsize=20, verticalalignment='bottom', horizontalalignment='center')
    plt.text(110-i, yds_from_sideline, str(i), color='white', fontsize=20, verticalalignment='bottom', horizontalalignment='center')

# Paint 50 yard line numbers
plt.text(60, 53.3-yds_from_sideline, str(50), color='white', fontsize=20, verticalalignment='bottom', horizontalalignment='center', rotation=180)
plt.text(60, yds_from_sideline, str(50), color='white', fontsize=20, verticalalignment='bottom', horizontalalignment='center')

# Print something in the endzones

plt.text(5, 26.5, 'Vikings', color='#4F2683', fontsize=30, verticalalignment='center', horizontalalignment='center', rotation=90)
plt.text(115, 26.5, 'Opponent', color='black', fontsize=30, verticalalignment='center', horizontalalignment='center', rotation=270)

# Just showing how to set titles and labels
plt.title('The gridiron', fontsize=14)
plt.ylabel('EPA', fontsize=12)
plt.xlabel('Yardline', fontsize=12)

plt.title('The gridiron', fontsize=14)
plt.ylabel('EPA', fontsize=12)
plt.xlabel('Yardline', fontsize=12)

ax.set_yticks(np.arange(-5, 6,1))

ax.scatter(x='yardline_100',y='epa',data=data)


# Fix the aspect ratio (optional)
plt.gca().set_aspect(1)

# Display the figure
plt.show()
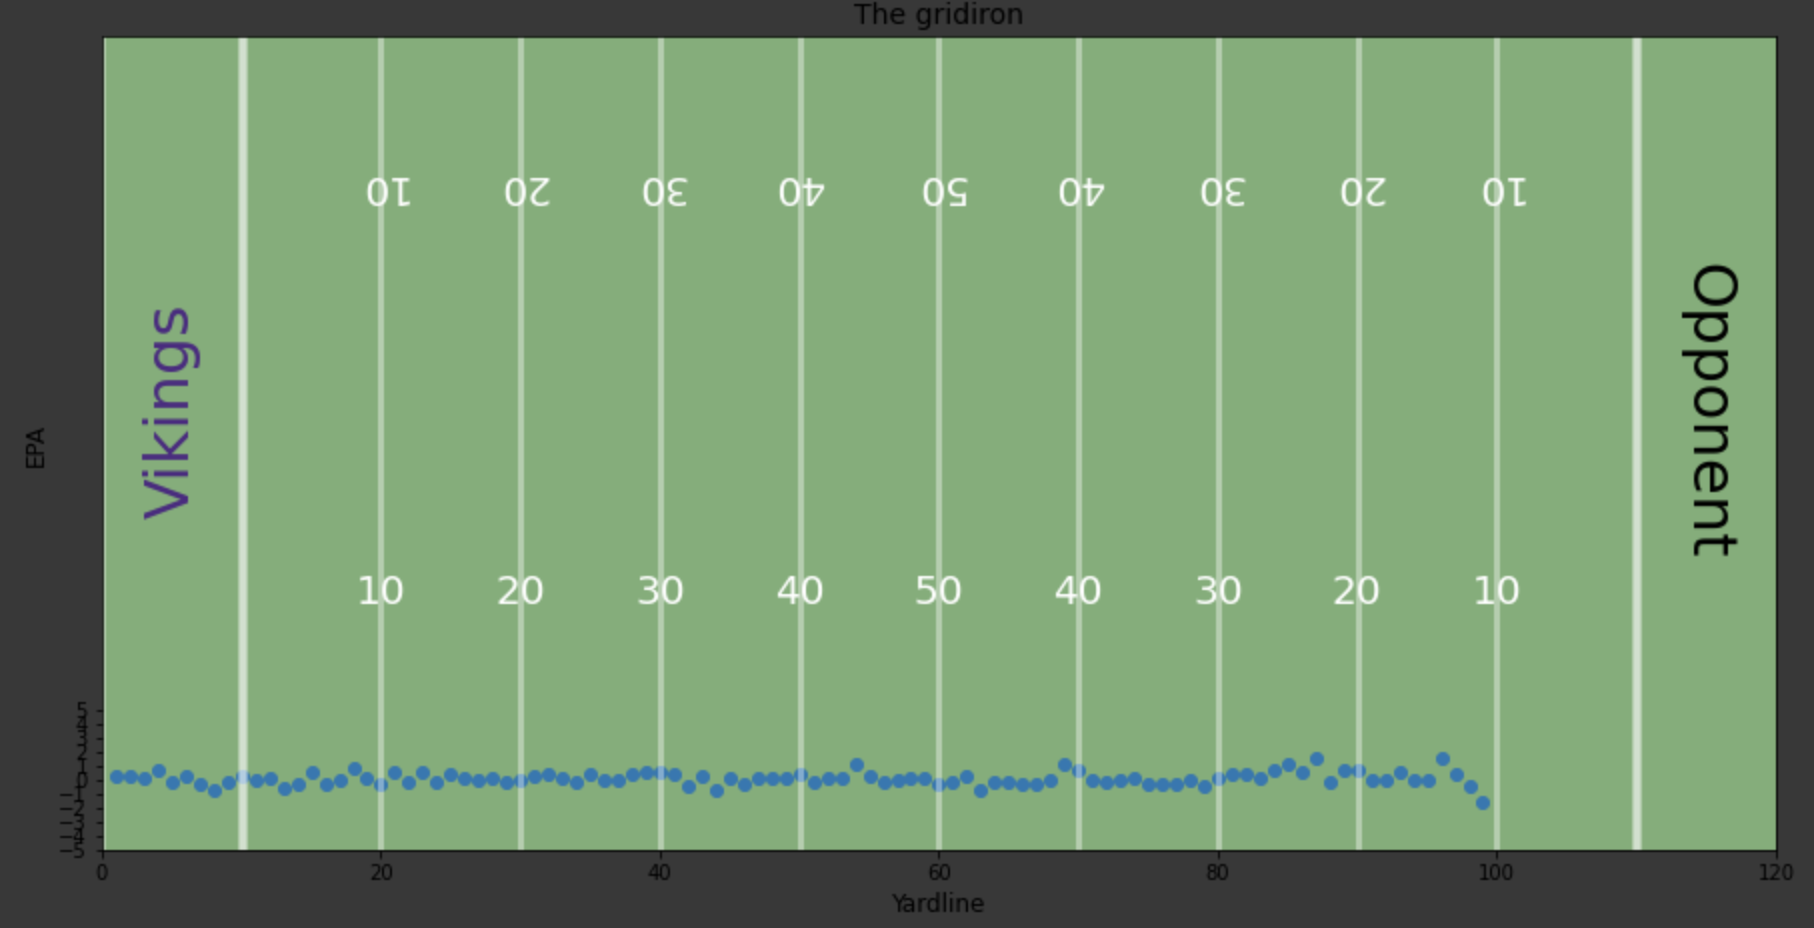
我真正想做的是缩放轴,SO-5在底部,5在y轴的顶部,而不是在底部缩小-5到5范围。此外,我想移动x轴超过10个单位,而以同样的方式.也就是说,我想从X=10开始,而不是从X=0开始。如果您需要进一步澄清,请告诉我。谢谢!
回答 1
Stack Overflow用户
发布于 2020-07-09 18:57:25
不确定这是否是最好的方法,但我首先将ylim缩放到您想要的范围(- 5,5),然后将plt.text()的码值从范围(0,53.3 )缩放到范围(-5,5),相应地调整plt.text()中的顶部/底部值(从53.3到5,从0到-5)。最后,将ax.scatter()更改为直接引用您的数据列,因此在x轴上偏移添加了10的值。另外,删除了set_aspect(1)。
这样,你就不会在一开始就创造出一个过大的数字,然后你就不得不争论不休地屈服了。
# CHANGES HERE !!!代码(在代码之前更改注释)
import matplotlib.pyplot as plt
import pylab as pl
import numpy as np

# Create figure
fig, ax = pl.subplots(figsize=(15,10))

# Set field dimensions
plt.xlim(0, 120)  # Field length including endzones

# CHANGES HERE !!!
# set ylim respective to your data
plt.ylim(-5, 5)  # field width

# Set field color green
ax.set_facecolor('#79af75')
ax.set_alpha(0.5)

# Print lines
for i in range(0, 120, 10):
    plt.axvline(i, color='white', linewidth=3, alpha=0.4, zorder=1)
    if i == 10 or i == 110:  # Make endzone lines
        plt.axvline(i, color='white', linewidth=5, alpha=0.4, zorder=1)

# Paint numbers
yds_from_sideline = 12
for i in range(10, 50, 10):
#   CHANGES HERE !!!
#   change y values because ylim has changed (top-ylim - yds_from_sideline translated to scale of ylim)
    plt.text(i+10, 5-10*(yds_from_sideline/53.3), str(i), color='white', fontsize=20, verticalalignment='bottom', horizontalalignment='center', rotation=180)
    plt.text(110-i, 5-10*(yds_from_sideline/53.3),  str(i), color='white', fontsize=20, verticalalignment='bottom', horizontalalignment='center', rotation=180)

    plt.text(i+10, -5 + 10*(yds_from_sideline/53.3), str(i), color='white', fontsize=20, verticalalignment='bottom', horizontalalignment='center')
    plt.text(110-i, -5 + 10*(yds_from_sideline/53.3), str(i), color='white', fontsize=20, verticalalignment='bottom', horizontalalignment='center')

# Paint 50 yard line numbers
# CHANGES HERE !!!
# change y values here as well
plt.text(60, 5-10*(yds_from_sideline/53.3), str(50), color='white', fontsize=20, verticalalignment='bottom', horizontalalignment='center', rotation=180)
plt.text(60, -5+10*(yds_from_sideline/53.3), str(50), color='white', fontsize=20, verticalalignment='bottom', horizontalalignment='center')

# Print something in the endzones

plt.text(5, 0, 'Vikings', color='#4F2683', fontsize=30, verticalalignment='center', horizontalalignment='center', rotation=90)
plt.text(115, 0, 'Opponent', color='black', fontsize=30, verticalalignment='center', horizontalalignment='center', rotation=270)

# Just showing how to set titles and labels
plt.title('The gridiron', fontsize=14)
plt.ylabel('EPA', fontsize=12)
plt.xlabel('Yardline', fontsize=12)

plt.title('The gridiron', fontsize=14)
plt.ylabel('EPA', fontsize=12)
plt.xlabel('Yardline', fontsize=12)

ax.set_yticks(np.arange(-5, 6,1))

# CHANGES HERE !!!
# increase x by 10 to start at x = 10
ax.scatter(x=data['yardline_100']+10,y=data['epa'])


# # Fix the aspect ratio (optional)
# plt.gca().set_aspect(1)

# Display the figure
plt.show()
Output (使用示例数据)

https://stackoverflow.com/questions/62821320
复制相似问题
腾讯云开发者

Copyright © 2013 - 2026 Tencent Cloud. All Rights Reserved. 腾讯云 版权所有
深圳市腾讯计算机系统有限公司 ICP备案/许可证号:粤B2-20090059 ![]() 粤公网安备44030502008569号
粤公网安备44030502008569号
腾讯云计算(北京)有限责任公司 京ICP证150476号 | 京ICP备11018762号