
在p5js中创造一颗恒星的数学基础是什么?
我在做一个来自p5js.org - https://p5js.org/examples/form-star.html网站的示例代码。除了下面的一行之外,我理解了所有的代码。
function star(x, y, radius1, radius2, npoints) {
  let angle = TWO_PI / npoints;
  let halfAngle = angle / 2.0;
  beginShape();
  for (let a = 0; a < TWO_PI; a += angle) {
    let sx = x + cos(a) * radius2;
    let sy = y + sin(a) * radius2;
    vertex(sx, sy);
    sx = x + cos(a + halfAngle) * radius1;
    sy = y + sin(a + halfAngle) * radius1;
    vertex(sx, sy);
  }
  endShape(CLOSE);
}
什么是采取两个角度的概念。我知道这是用极坐标到笛卡尔坐标的映射。但我无法想象这种计算是如何工作的。作者是如何在代码中提出这个逻辑的?
回答 2
Stack Overflow用户
发布于 2020-07-14 11:34:00
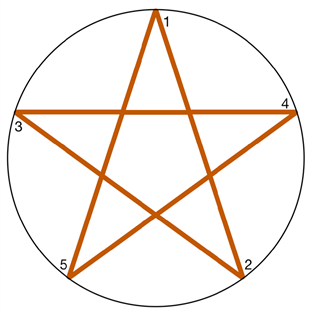
作者正在画线。要做到这一点,他们需要2分。
为了得到这些点的坐标,他们“想象”了一个圆,因为如果恒星是规则的,那么每个点都应该与中间的距离相同(因此在恒星的中点周围画了一个假想的圆)。如下所示:
现在,一个圆是360度,或者,以弧度表示,2* PI。如下所示:
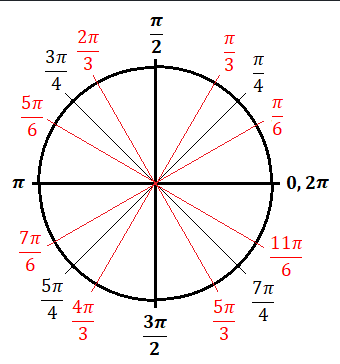
注意:右边是零弧度。如果你逆时针阅读,当你在圆圈的“顶部”时,你得到1/2的PI,当你在左边的时候,得到1* PI,底部的1,5 * PI,右边的2* PI。
通过将圆除以恒星所拥有的点数,作者现在可以使用三角学来获得绘制该恒星所需的坐标:
这就是我的想法。玩得开心!
Stack Overflow用户
发布于 2020-07-14 12:46:15
我的回答只是对laancelot的出色回答(+1)的附加视觉解释:
请看一下这个图表:
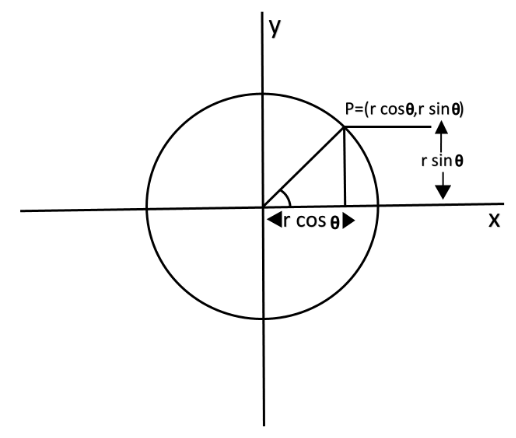
你可能已经习惯了笛卡尔坐标系,其中X轴是水平轴,Y是垂直于它的垂直轴,都是以0,0为中心。
有另一种方法从另一个角度来看待同样的x,y笛卡儿位置。
想象一下,从中心到点x,y的直线没有正方形网格。
如果点在时钟上,你可以用时间来描述这个点,比如说,时间点到x,y (是角度),而时钟句柄是到x,y的距离。
这是在极坐标系统中查看相同坐标的例子,其中坐标不是x,y,而是角度和半径(从中心到x,y的距离)。
在图表上,你可以看到AB是从中心到光标的点。回想一下古老的三角学助记符:SOH-CAH (sin =相反/低耗能,cos =相邻/低耗能)。
如果我们知道一个点的角度和半径,我们就可以解x,y。
sin(angle) = BC (y) / AB (radius) 这和
sin(angle) / 1 = y / radius我们可以从中提取:
y = sin(angle) * radius和类似的
cos(angle) = AC (x) / AB (radius) 这和
cos(angle) / 1 = x / radius我们可以从中提取:
x = cos(angle) * radius因此,极地(角,半径)到笛卡尔(x,y)的转换公式:
x = cos(angle) * radius
y = sin(angle) * radius加分:现在您可以直观地了解区()函数是如何在引擎盖下工作的。
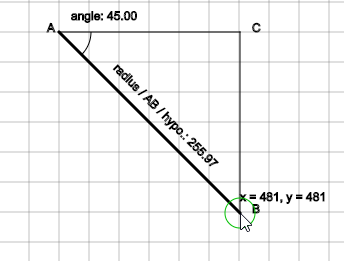
用毕达哥拉斯定理求解中心和鼠标位置所形成的直角三角形的不足是很简单的。
AC = mouseX - centerX
BC = mouseY - centerY
dist = sqrt( (AB * AB) + (BC * BC) )
实际上,您可以在这里播放该插图:
let showCartesian = true;
let showPolar = true;

let explanation = "cos(angle) = AC (x) / AB (radius)\n" +
                  "cos(angle) / 1 = x / radius\n" +
                  "x = cos(angle) * radius\n\n" +
                  "sin(angle) = BC (y) / AB (radius)\n" +
                  "sin(angle) / 1 = y / radius\n" +
                  "y = sin(angle) * radius\n\n";

function setup() {
  createCanvas(600, 600);
}

function draw() {

  background(255);
  if(showCartesian) drawCartesianGrid(20,20,30);
  if(showPolar) drawPolarGrid(300, 300, 30);
  stroke(0);
  // instructions
  text("press 'c' to toggle cartesian grid\n" +
       "press 'p' to toggle polar grid\n\n" + explanation, 10, 15);

  stroke(0);

  // center
  let cx = width * 0.5;
  let cy = height * 0.5;
  // mouse
  let x = mouseX;
  let y = mouseY;

  // cartesian to polar conversion (e.g. x,y to angle, radius )
  let angle = atan2(y - cy, x - cx);
  let radius = dist(cx, cy, x, y);
  // polar to cartesian conversion
  let px = cos(angle) * radius;
  let py = sin(angle) * radius;

  // visualise triangle
  strokeWeight(3);
  line(cx, cy, x, y);
  strokeWeight(1);
  line(cx, cy, x, cx);
  line(x, cy, x, y);
  text("x = " + nfc(x, 0) + ", y = " + nfc(y, 0), x, y - 12);
  // visualise angle
  noFill();
  arc(cx, cy, radius * 0.25, radius * 0.25, angle < 0 ? angle : 0, angle < 0 ? 0 : angle);
  text("angle: " + nfc(degrees(angle),2), cx + 12, cy - 12);
  // visualise radius / hypothenuse / AB
  push();
    translate(cx, cy);
    rotate(angle);
    text("radius / AB / hypo.: " + nfc(radius, 2), radius * 0.25, -12);
  pop();
  // triangle corner labels
  text("A", cx - 12, cy);
  text("B", x + 12, y);
  text("C", x + 12, cy);
  // visualise cartesian coordinate point (offset from centre = same as x,y)
  stroke(0,192,0);
  ellipse(cx + px, cy + py, 30, 30);
}

function drawCartesianGrid(segsW, segsH, spacing){
  stroke(198);
  for(let y = 0; y < segsH; y++){
    for(let x = 0; x < segsW; x++){
      line(x * spacing, y * spacing,
           (x+1) * spacing, y * spacing);
      line(x * spacing, y * spacing,
           x * spacing, (y+1) * spacing);
    }
  }
}

function drawPolarGrid(x,y,spacing){
  let count = width / spacing;
  let cx = width * 0.5;
  let cy = height * 0.5;
  stroke(192);
  for(let i = 1 ; i <= count; i++){
    ellipse(x, y, (spacing * 2) * i);
  }
  stroke(127);
  line(cx, 0, cx, height);
  line(0, cy, width, cy);
  line(0, 0, width, height);
  line(0, height, width, 0);
}

function keyPressed(){
  if(key == 'c'){
    showCartesian = !showCartesian;
  }
  if(key == 'p'){
    showPolar = !showPolar;
  }
} <script src="https://cdnjs.cloudflare.com/ajax/libs/p5.js/1.0.0/p5.min.js"></script>
(Note,与数学类相反,笛卡尔系统原点位于中心,Y轴正向上,在p5.js中,0,0是左上角,y向下递增。同样地,要注意的角度是从-180 (-PI)到180 (PI),指向右边,而不是0,360 (0 - TWO_PI)范围)。
为了好玩,您可以注释掉在star()函数中绘制的顶点,以了解angle/halfAngle以及radius1、radius2是什么点、如何变化的。
对于核心的彻底检查,可以使用JS调试器在每个vertex(sx, sy);上放置一个断点,并查看angle/halfAngle是如何变化的。
https://stackoverflow.com/questions/62893486
复制相似问题
腾讯云开发者

Copyright © 2013 - 2026 Tencent Cloud. All Rights Reserved. 腾讯云 版权所有
深圳市腾讯计算机系统有限公司 ICP备案/许可证号:粤B2-20090059 ![]() 粤公网安备44030502008569号
粤公网安备44030502008569号
腾讯云计算(北京)有限责任公司 京ICP证150476号 | 京ICP备11018762号