
使用par mar和oma提高png地块的边际
使用par mar和oma提高png地块的边际
提问于 2020-07-16 00:47:20
我希望增加y轴标签和轴数之间的距离(在示例中,在“高度”和“1.5”之间有更多的空间),并且在轴标签的左边也有更多的空间。
在mar和oma中更改par不会做任何事情。一些类似的问题here和here,但因为他们没有可重复的例子,它没有解决我的问题。我不使用任何包裹。
这是我的密码:
Height = c(3.1, 0.4, 0.9, 2.6, 1.4, 2.1)
Diameter = c(1.0, 0.4, 0.8, 1.1, 0.5, 0.4)
size.data = data.frame(Height, Diameter)

par(mfrow = c(1, 1), mar = c(4, 5, 6, 1), oma = c(0.5, 1, 1, 0.5), mgp = c(2.2, 0.7, 0))
png('Figure.1.png', width = 2800, height = 2400, res = 220)
plot(Height ~ Diameter, data = size.data, xaxs = 'i', yaxs = 'i',
ylim = c(0, 3), xlim = c(0, 1.5), bty = 'n', box = FALSE,
xlab = 'Diameter', ylab = 'Height', cex = 1.3, cex.axis = 1.3, cex.lab = 1.3, cex.main = 1.3,
pch = 21, bg = 'white', las = 1)
#mtext('Height', side = 2, at = 101, line = 1.1, cex = 1.3)
box(bty = 'L')
dev.off()

par(mfrow = c(1, 1), mar = c(4, 10, 6, 1), oma = c(0.5, 4, 1, 0.5), mgp = c(2.2, 0.7, 0))
png('Figure.2.png', width = 2800, height = 2400, res = 220)
plot(Height ~ Diameter, data = size.data, xaxs = 'i', yaxs = 'i',
ylim = c(0, 3), xlim = c(0, 1.5), bty = 'n', box = FALSE,
xlab = 'Diameter', ylab = 'Height', cex = 1.3, cex.axis = 1.3, cex.lab = 1.3, cex.main = 1.3,
pch = 21, bg = 'white', las = 1)
#mtext('Height', side = 2, at = 101, line = 1.1, cex = 1.3)
box(bty = 'L')
dev.off()更改mar和oma不会做任何事情,并且会生成完全相同的情节!
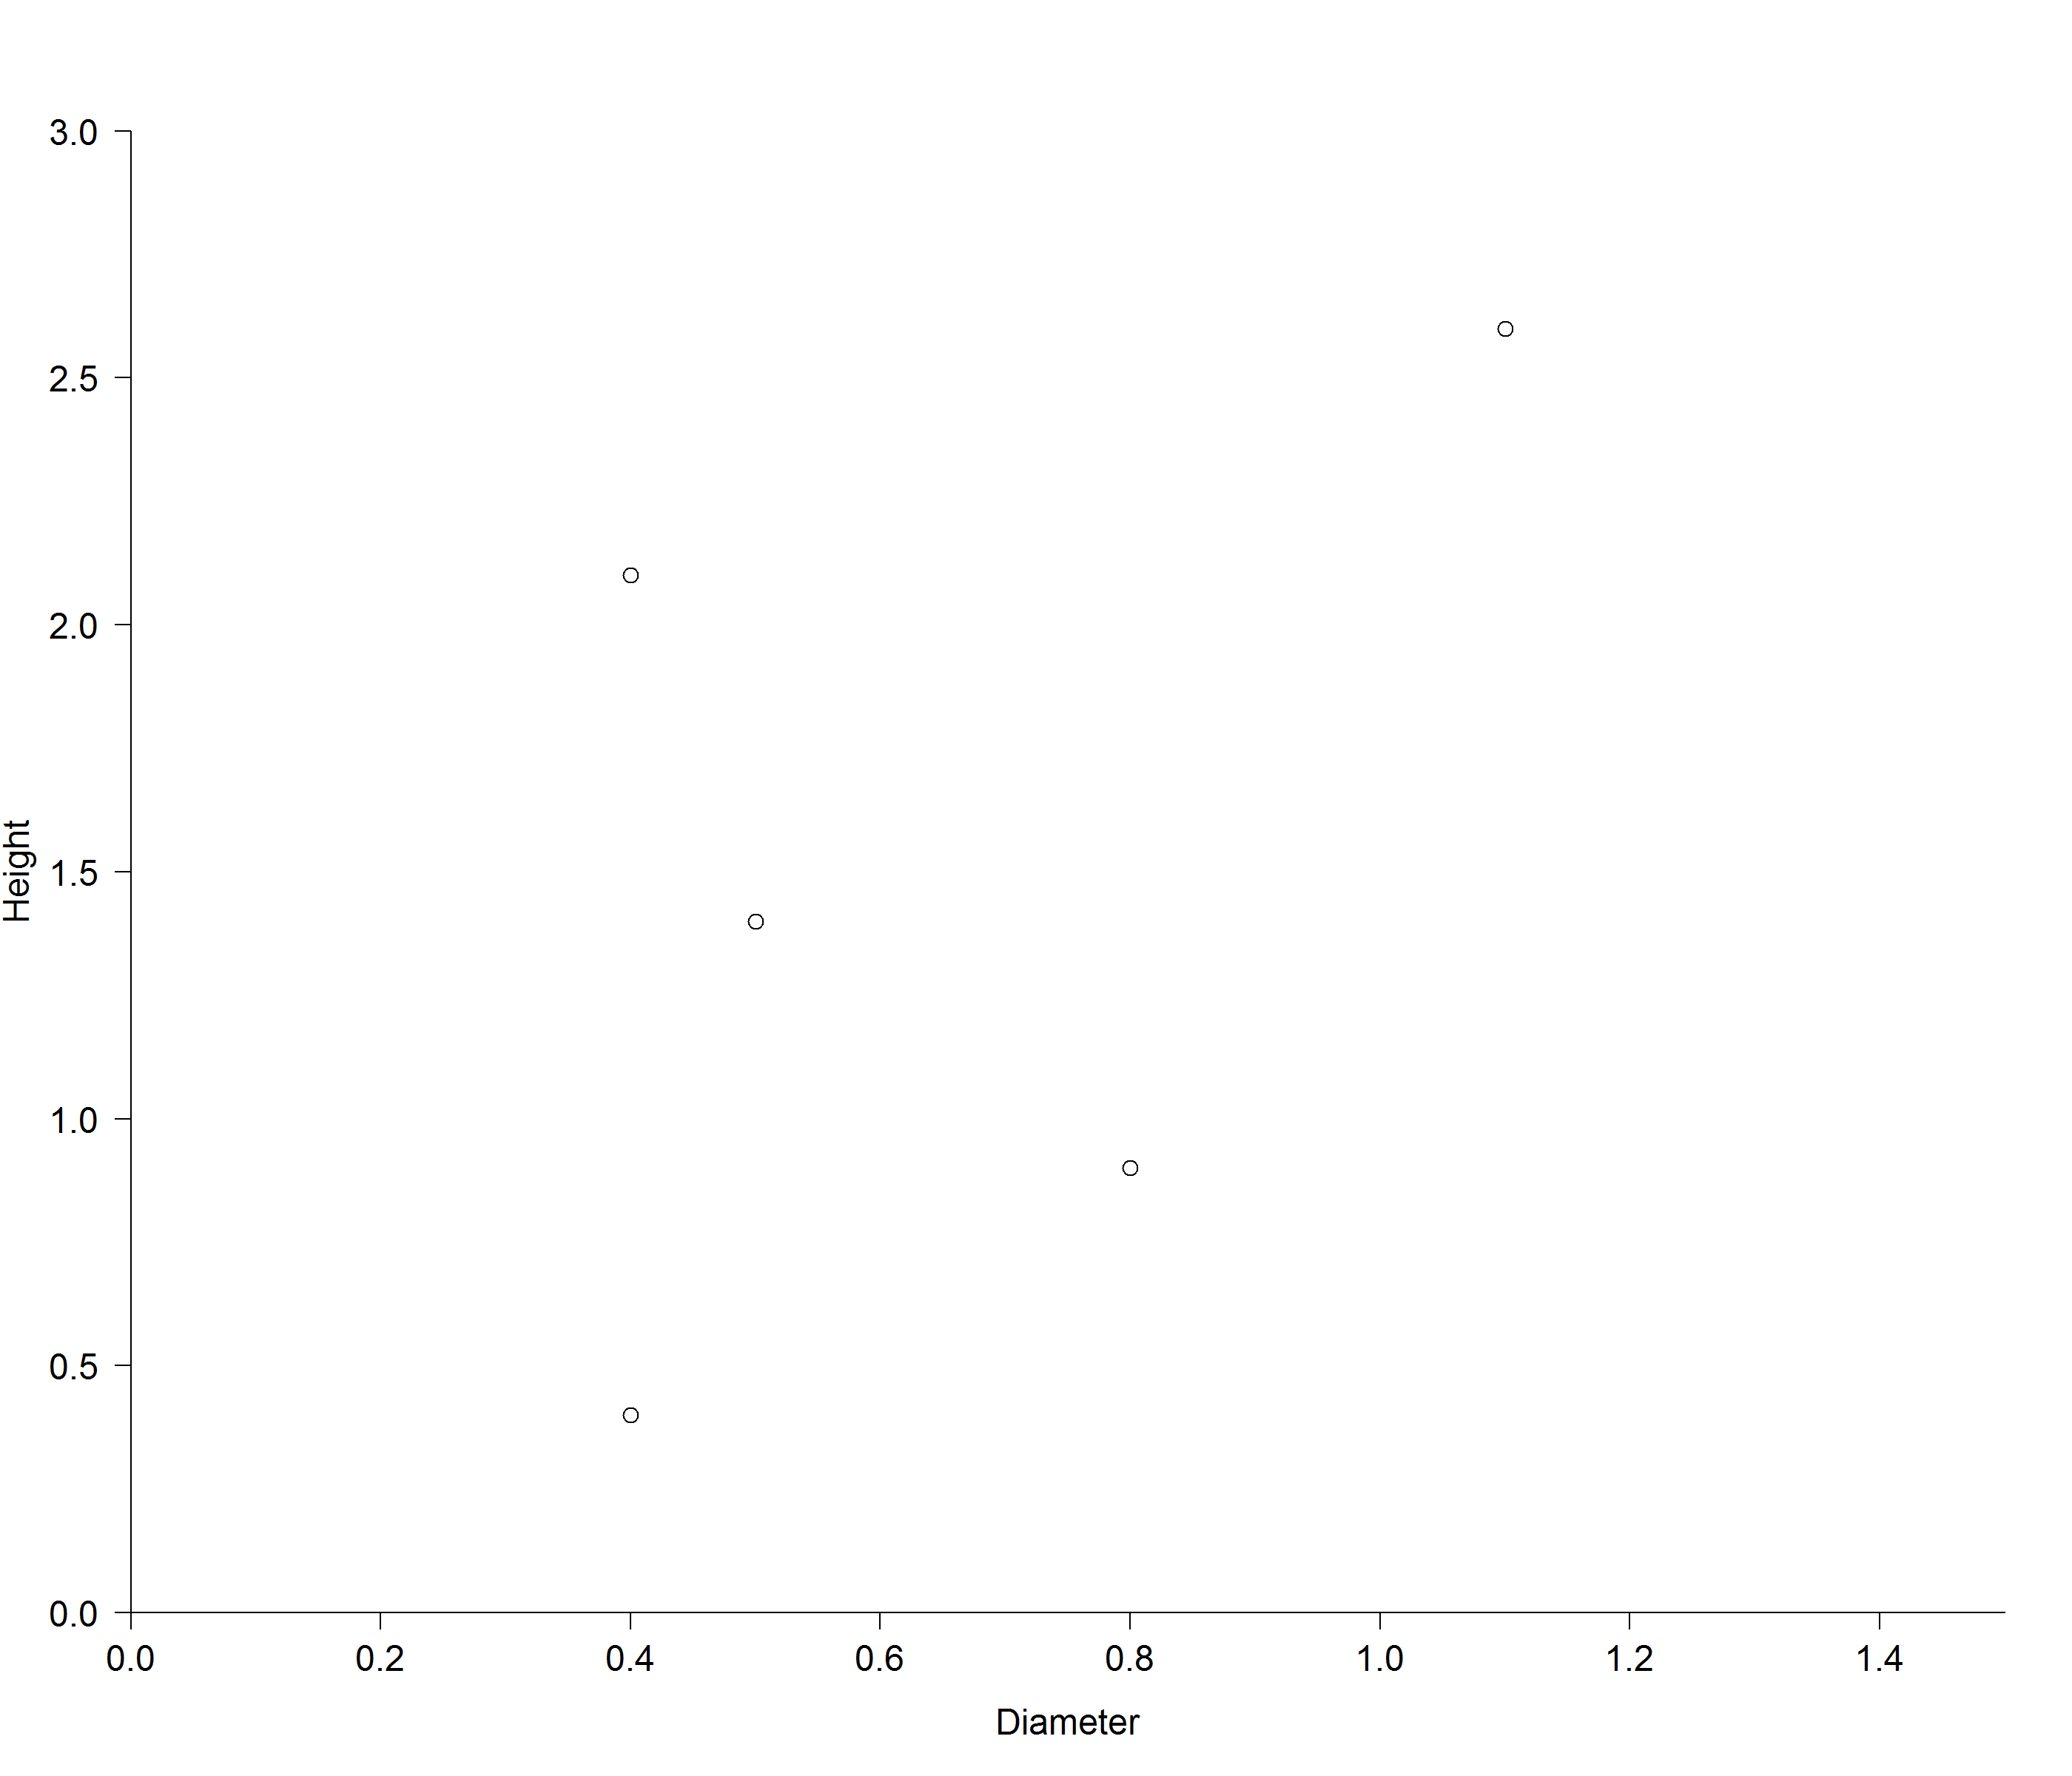
Figure.1
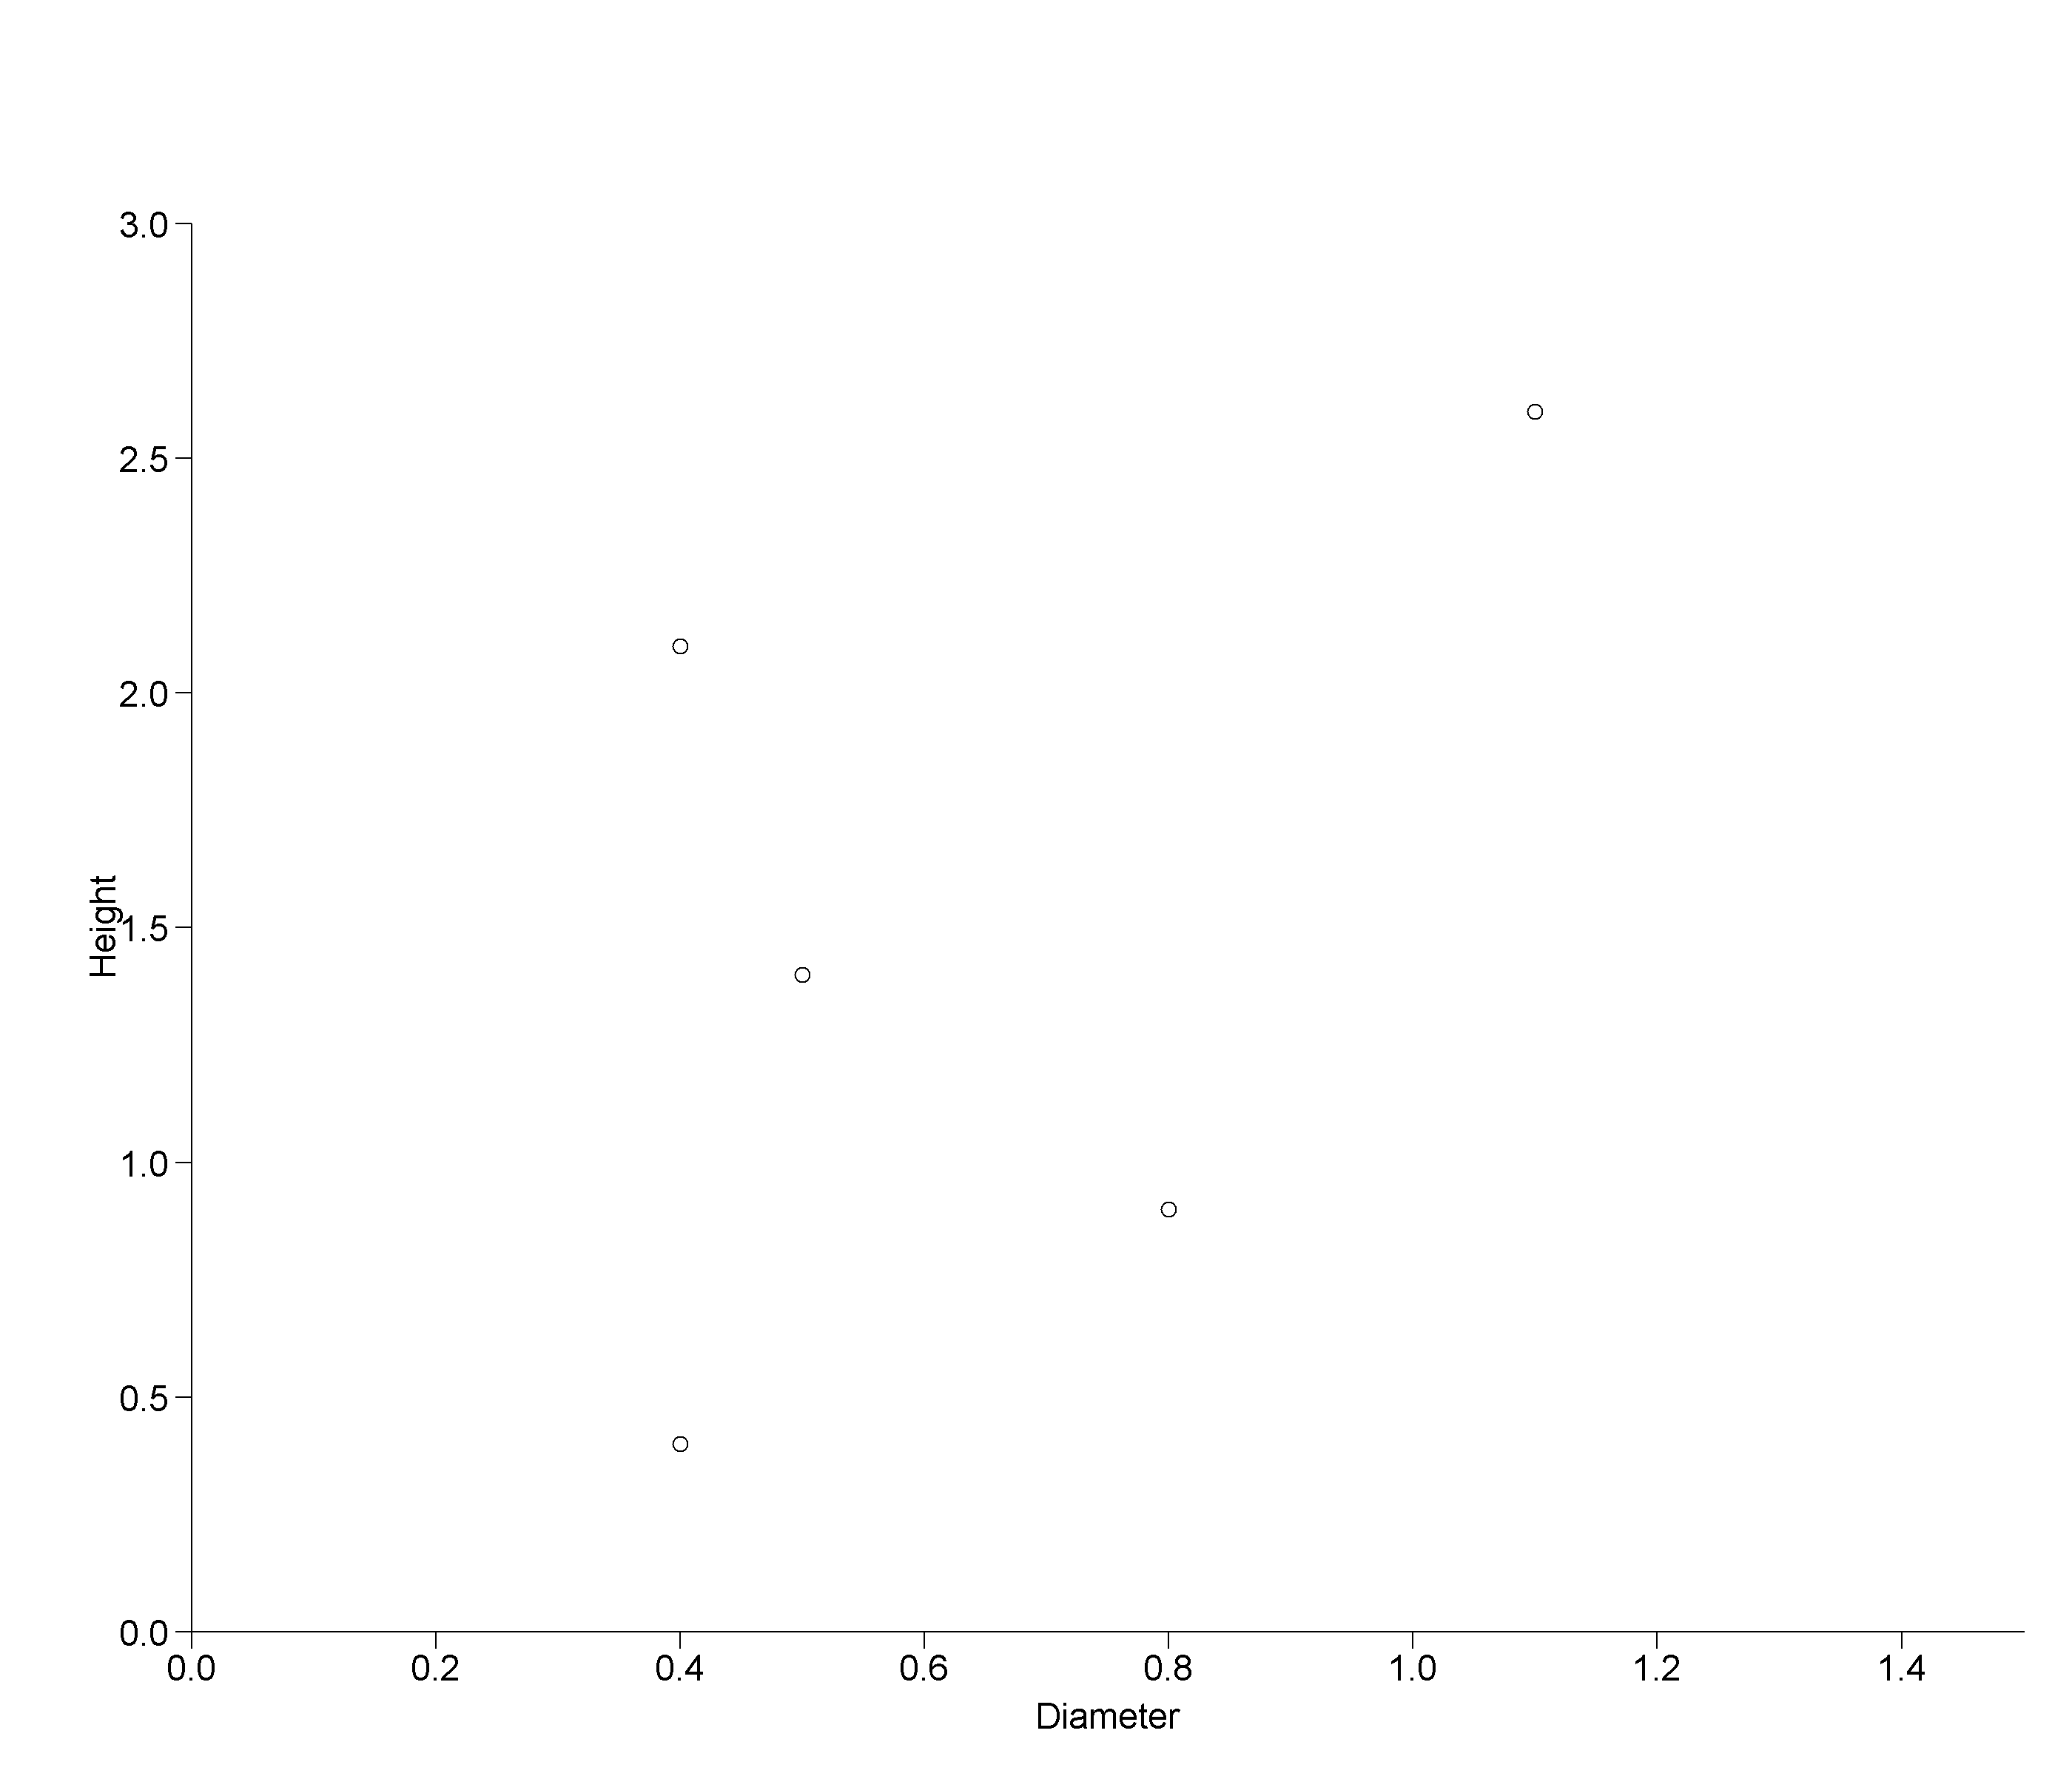
Figure.2
我试着使用mtext分别设置y轴标签,但是由于没有足够的空白,所以我试图更改它,它也没有显示。我不知道我错过了什么基本的东西,我很感激任何帮助。
回答 1
Stack Overflow用户
回答已采纳
发布于 2020-07-16 00:58:00
您必须在调用par之后再打电话给png。
png('Figure.1.png', width = 2800, height = 2400, res = 220)
par(mfrow = c(1, 1), mar = c(4, 5, 6, 1), oma = c(0.5, 1, 1, 0.5), mgp = c(2.2, 0.7, 0))
和
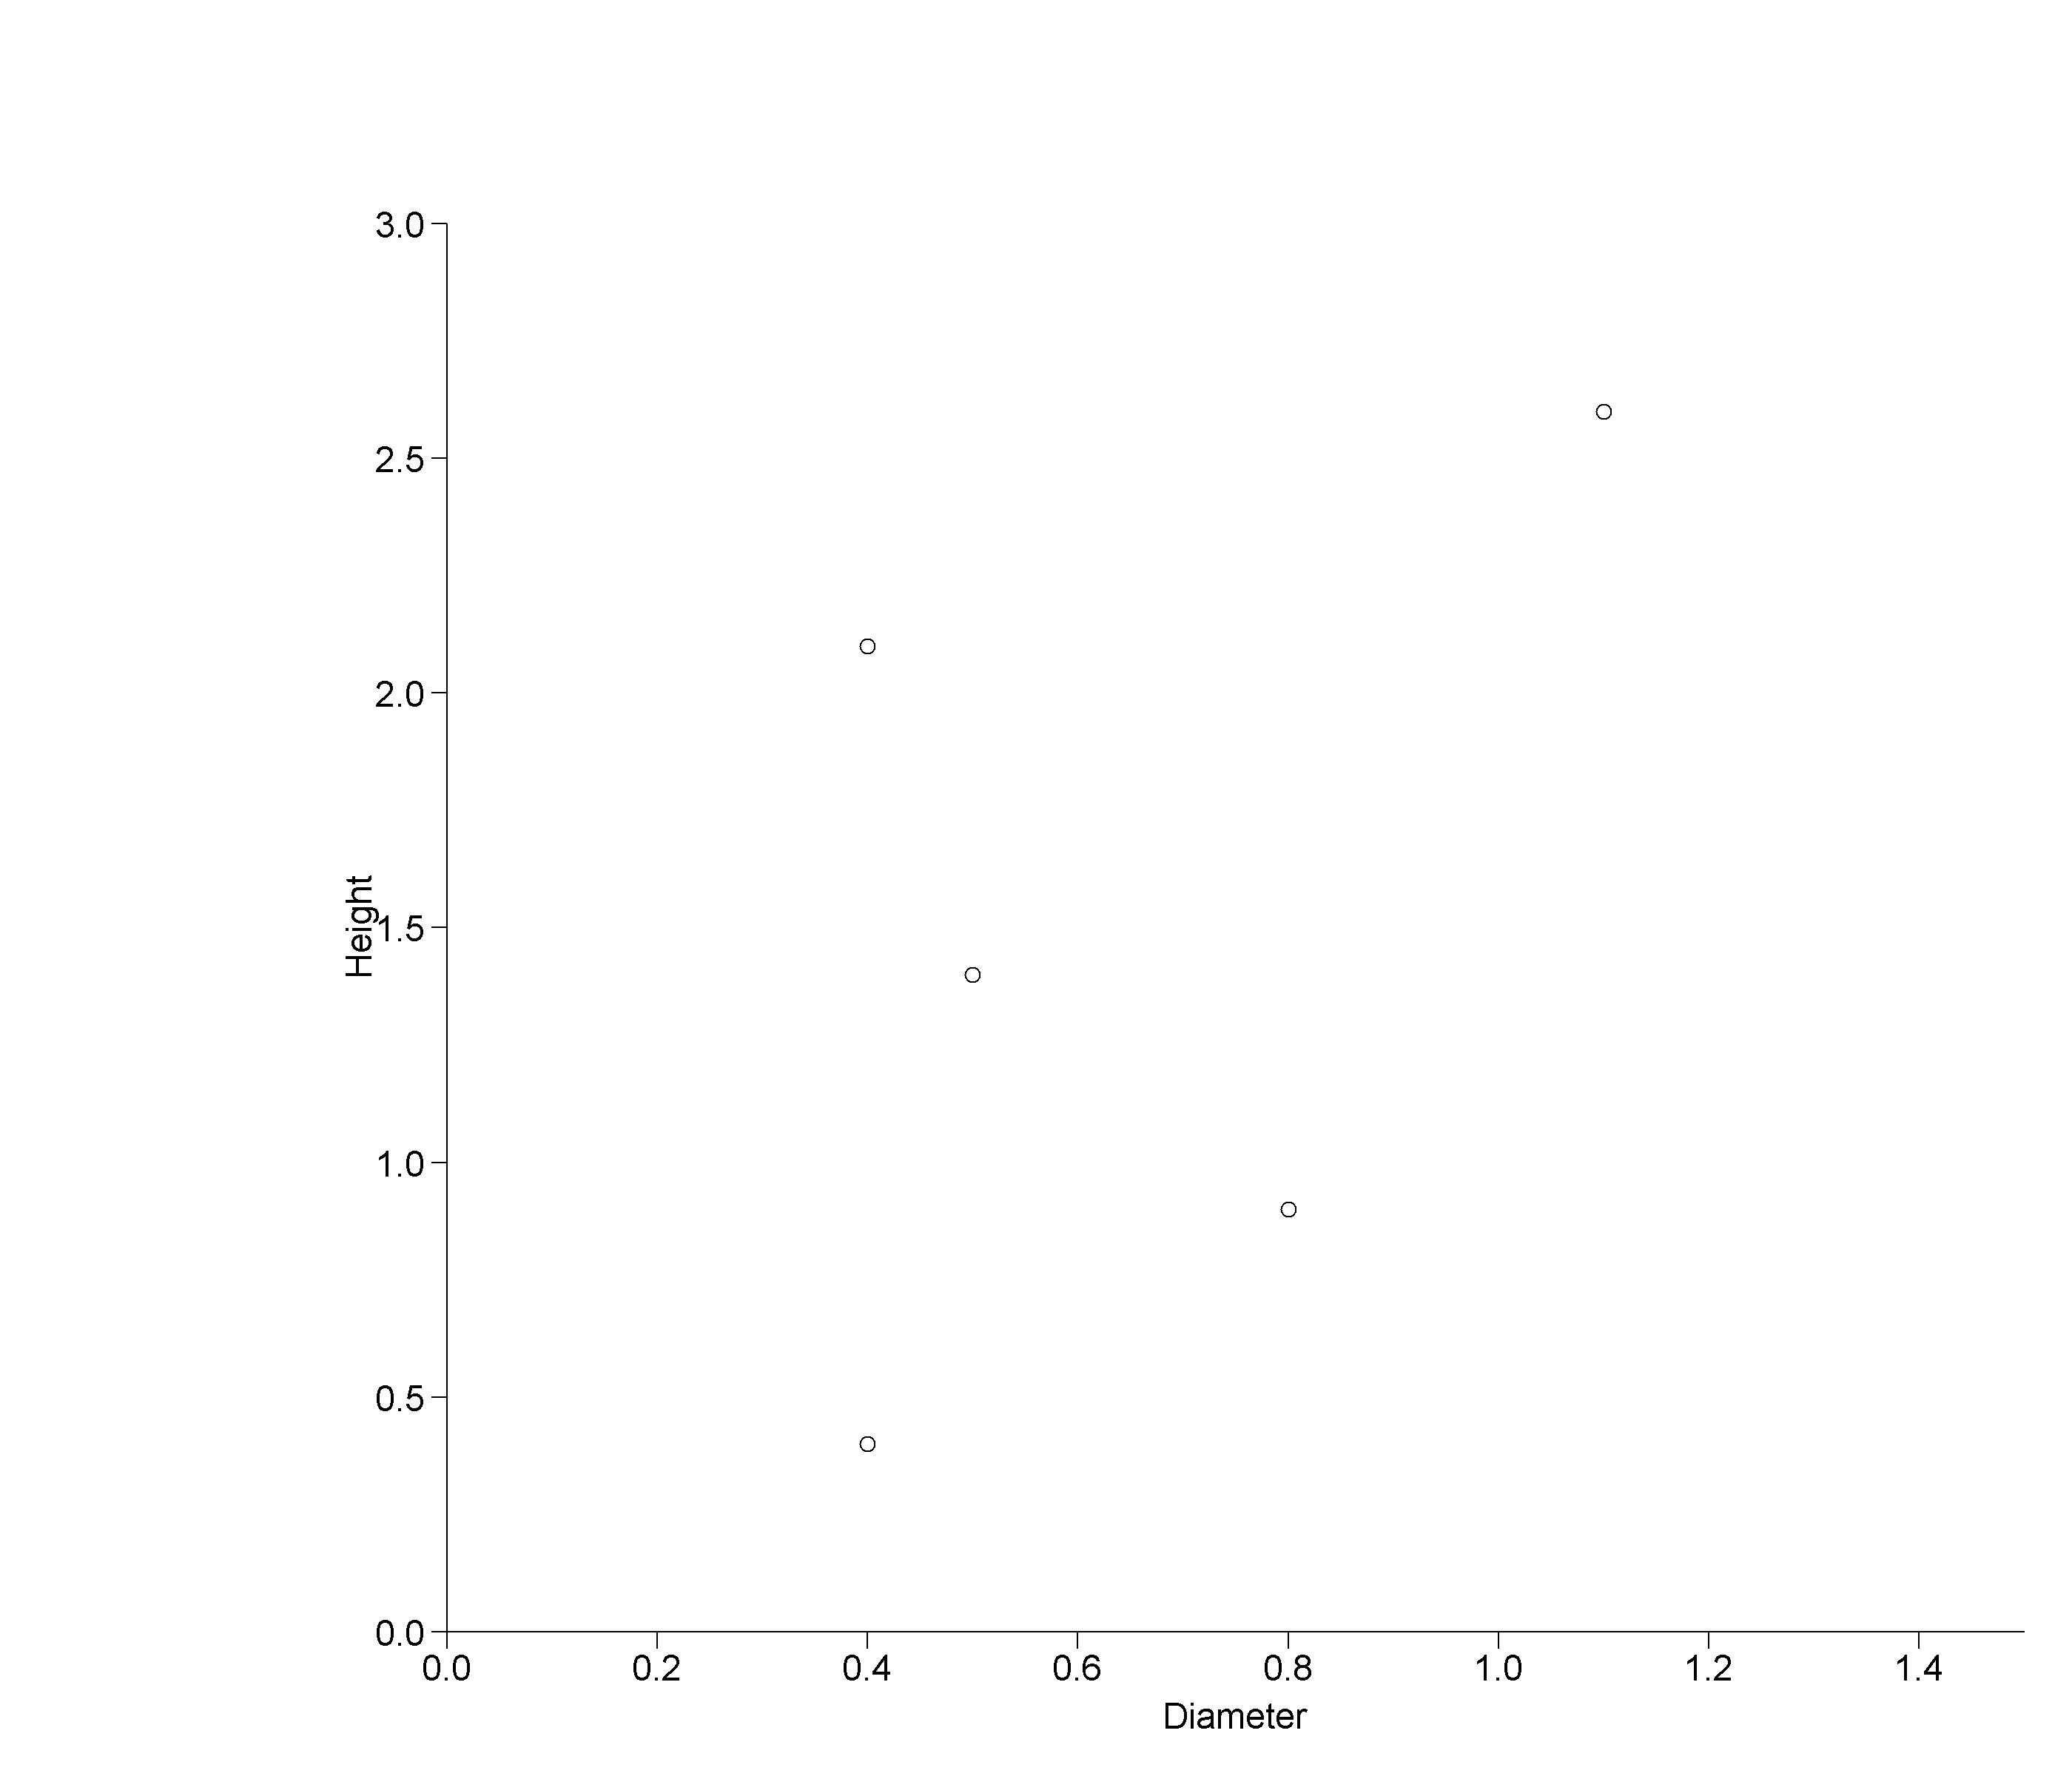
png('Figure.2.png', width = 2800, height = 2400, res = 220)
par(mfrow = c(1, 1), mar = c(4, 10, 6, 1), oma = c(0.5, 4, 1, 0.5), mgp = c(2.2, 0.7, 0))
这些情节看上去如下:
页面原文内容由Stack Overflow提供。腾讯云小微IT领域专用引擎提供翻译支持
原文链接:
https://stackoverflow.com/questions/62925798
复制相关文章
相似问题
腾讯云开发者

Copyright © 2013 - 2026 Tencent Cloud. All Rights Reserved. 腾讯云 版权所有
深圳市腾讯计算机系统有限公司 ICP备案/许可证号:粤B2-20090059 ![]() 粤公网安备44030502008569号
粤公网安备44030502008569号
腾讯云计算(北京)有限责任公司 京ICP证150476号 | 京ICP备11018762号