
ActiveMQ上的实时日志
如何在安装在RHEL服务器上的Apache中看到活动日志?
我通过执行以下操作启用了日志功能:
我进入了/web/servers/apache-activemq-5.15.8/conf位置,编辑了log4j.properties文件,然后取消了这一行的注释:
log4j.logger.org.apache.activemq=DEBUG在安装在Windows上的ActiveMQ版本上,我通常从命令行启动它,以便显示与连接相关的实时日志。然而,在RHEL上,我不知道如何获得实时日志。在Tomcat中,我可以在tail -f catalina.out文件夹中运行logs。在ActiveMQ中是否存在相同的东西?
以下是我的log4j.properties文件,以防万一。
## ---------------------------------------------------------------------------
## Licensed to the Apache Software Foundation (ASF) under one or more
## contributor license agreements.  See the NOTICE file distributed with
## this work for additional information regarding copyright ownership.
## The ASF licenses this file to You under the Apache License, Version 2.0
## (the "License"); you may not use this file except in compliance with
## the License.  You may obtain a copy of the License at
##
## http://www.apache.org/licenses/LICENSE-2.0
##
## Unless required by applicable law or agreed to in writing, software
## distributed under the License is distributed on an "AS IS" BASIS,
## WITHOUT WARRANTIES OR CONDITIONS OF ANY KIND, either express or implied.
## See the License for the specific language governing permissions and
## limitations under the License.
## ---------------------------------------------------------------------------

#
# This file controls most of the logging in ActiveMQ which is mainly based around
# the commons logging API.
#
log4j.rootLogger=INFO, console, logfile
log4j.logger.org.apache.activemq.spring=WARN
log4j.logger.org.apache.activemq.web.handler=WARN
log4j.logger.org.springframework=WARN
log4j.logger.org.apache.xbean=WARN
log4j.logger.org.apache.camel=INFO
log4j.logger.org.eclipse.jetty=WARN

# When debugging or reporting problems to the ActiveMQ team,
# comment out the above lines and uncomment the next.

#log4j.rootLogger=DEBUG, logfile, console

# Or for more fine grained debug logging uncomment one of these
log4j.logger.org.apache.activemq=DEBUG
#log4j.logger.org.apache.camel=DEBUG

# Console appender
log4j.appender.console=org.apache.log4j.ConsoleAppender
log4j.appender.console.layout=org.apache.log4j.PatternLayout
log4j.appender.console.layout.ConversionPattern=%5p | %m%n
log4j.appender.console.threshold=INFO

# File appender
log4j.appender.logfile=org.apache.log4j.RollingFileAppender
log4j.appender.logfile.file=${activemq.data}/activemq.log
log4j.appender.logfile.maxFileSize=1024KB
log4j.appender.logfile.maxBackupIndex=5
log4j.appender.logfile.append=true
log4j.appender.logfile.layout=org.apache.log4j.PatternLayout
log4j.appender.logfile.layout.ConversionPattern=%d | %-5p | %m | %c | %t%n
# use some of the following patterns to see MDC logging data
#
# %X{activemq.broker}
# %X{activemq.connector}
# %X{activemq.destination}
#
# e.g.
#
# log4j.appender.logfile.layout.ConversionPattern=%d | %-20.20X{activemq.connector} | %-5p | %m | %c | %t%n

log4j.throwableRenderer=org.apache.log4j.EnhancedThrowableRenderer

###########
# Audit log
###########

log4j.additivity.org.apache.activemq.audit=false
log4j.logger.org.apache.activemq.audit=INFO, audit

log4j.appender.audit=org.apache.log4j.RollingFileAppender
log4j.appender.audit.file=${activemq.data}/audit.log
log4j.appender.audit.maxFileSize=1024KB
log4j.appender.audit.maxBackupIndex=5
log4j.appender.audit.append=true
log4j.appender.audit.layout=org.apache.log4j.PatternLayout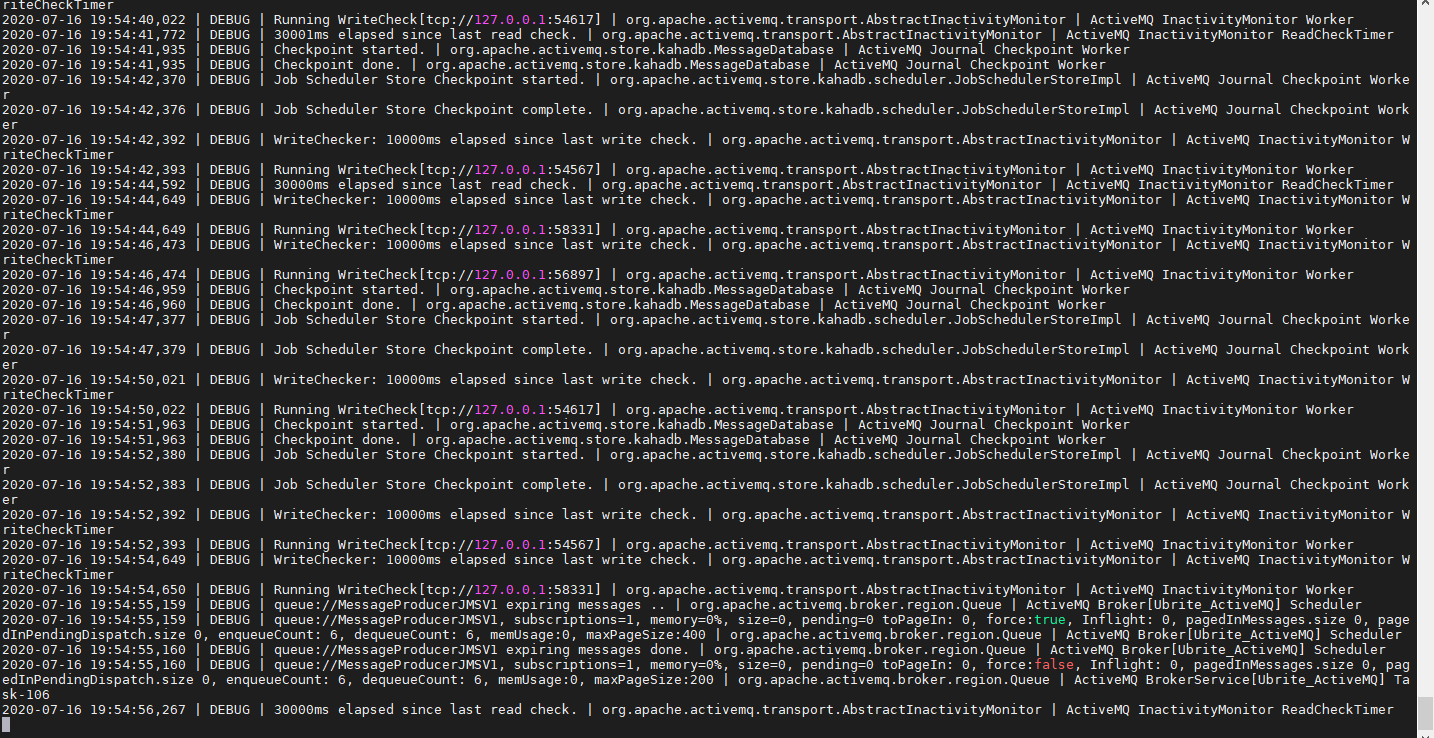
log4j.appender.audit.layout.ConversionPattern=%-5p | %m | %t%n当我执行tail -f activemq.log时,我看到屏幕不断向下滚动,它显示了我提到的一些命令。因此,这个控制台看起来不像一个稳定的控制台,尽管从我的角度来看,ActiveMQ现在没有任何变化。一段时间后,不停的滚动确实停止了。以下是我收到的一些内容:
2020-07-16 19:48:52,391 | DEBUG | WriteChecker: 10001ms elapsed since last write check. | org.apache.activemq.transport.AbstractInactivityMonitor | ActiveMQ InactivityMonitor WriteCheckTimer
2020-07-16 19:48:52,391 | DEBUG | Running WriteCheck[tcp://127.0.0.1:54567] | org.apache.activemq.transport.AbstractInactivityMonitor | ActiveMQ InactivityMonitor Worker
2020-07-16 19:48:54,648 | DEBUG | WriteChecker: 10000ms elapsed since last write check. | org.apache.activemq.transport.AbstractInactivityMonitor | ActiveMQ InactivityMonitor WriteCheckTimer
2020-07-16 19:48:54,649 | DEBUG | Running WriteCheck[tcp://127.0.0.1:58331] | org.apache.activemq.transport.AbstractInactivityMonitor | ActiveMQ InactivityMonitor Worker
2020-07-16 19:48:55,159 | DEBUG | queue://MessageProducerJMSV1 expiring messages .. | org.apache.activemq.broker.region.Queue | ActiveMQ Broker[Ubrite_ActiveMQ] Scheduler
2020-07-16 19:48:55,159 | DEBUG | queue://MessageProducerJMSV1, subscriptions=1, memory=0%, size=0, pending=0 toPageIn: 0, force:true, Inflight: 0, pagedInMessages.size 0, pagedInPendingDispatch.size 0, enqueueCount: 6, dequeueCount: 6, memUsage:0, maxPageSize:400 | org.apache.activemq.broker.region.Queue | ActiveMQ Broker[Ubrite_ActiveMQ] Scheduler
2020-07-16 19:48:55,160 | DEBUG | queue://MessageProducerJMSV1 expiring messages done. | org.apache.activemq.broker.region.Queue | ActiveMQ Broker[Ubrite_ActiveMQ] Scheduler
2020-07-16 19:48:55,160 | DEBUG | queue://MessageProducerJMSV1, subscriptions=1, memory=0%, size=0, pending=0 toPageIn: 0, force:false, Inflight: 0, pagedInMessages.size 0, pagedInPendingDispatch.size 0, enqueueCount: 6, dequeueCount: 6, memUsage:0, maxPageSize:200 | org.apache.activemq.broker.region.Queue | ActiveMQ BrokerService[Ubrite_ActiveMQ] Task-105
2020-07-16 19:48:56,267 | DEBUG | 30000ms elapsed since last read check. | org.apache.activemq.transport.AbstractInactivityMonitor | ActiveMQ InactivityMonitor ReadCheckTimer
2020-07-16 19:48:56,473 | DEBUG | WriteChecker: 10000ms elapsed since last write check. | org.apache.activemq.transport.AbstractInactivityMonitor | ActiveMQ InactivityMonitor WriteCheckTimer
2020-07-16 19:48:56,474 | DEBUG | Running WriteCheck[tcp://127.0.0.1:56897] | org.apache.activemq.transport.AbstractInactivityMonitor | ActiveMQ InactivityMonitor Worker
2020-07-16 19:48:56,634 | DEBUG | Checkpoint started. | org.apache.activemq.store.kahadb.MessageDatabase | ActiveMQ Journal Checkpoint Worker
2020-07-16 19:48:56,634 | DEBUG | Checkpoint done. | org.apache.activemq.store.kahadb.MessageDatabase | ActiveMQ Journal Checkpoint Worker
2020-07-16 19:48:57,104 | DEBUG | Job Scheduler Store Checkpoint started. | org.apache.activemq.store.kahadb.scheduler.JobSchedulerStoreImpl | ActiveMQ Journal Checkpoint Worke
粘贴截图如下:
回答 1
Stack Overflow用户
发布于 2020-07-17 02:09:38
使用tail -f activemq.log是查看来自ActiveMQ的“活动”日志的好方法。
您看到这么多日志记录的原因是您取消了这一行的注释:
log4j.logger.org.apache.activemq=DEBUG这为代理的大多数类启用了调试日志记录。调试日志记录主要针对那些非常熟悉内部代理操作并试图诊断问题的开发人员或管理员。这就是为什么日志记录如此冗长。
此外,请记住,代理的线程在后台不断运行,执行各种内部任务。这些线程可以记录调试信息。因此,即使没有客户机直接与代理交互,您仍然可以看到调试日志记录。这与经纪人的稳定性没有直接关系。
如果您将这一行注释回原处,那么日志记录的数量将大大减少,并且几乎肯定会更像您习惯看到的内容。
https://stackoverflow.com/questions/62923395
复制相似问题
腾讯云开发者

Copyright © 2013 - 2026 Tencent Cloud. All Rights Reserved. 腾讯云 版权所有
深圳市腾讯计算机系统有限公司 ICP备案/许可证号:粤B2-20090059 ![]() 粤公网安备44030502008569号
粤公网安备44030502008569号
腾讯云计算(北京)有限责任公司 京ICP证150476号 | 京ICP备11018762号