
使用Matplotlib对分组数据进行绘图
使用Matplotlib对分组数据进行绘图
提问于 2020-07-22 19:05:44
我使用Matplotlib和Pandas按y绘制x,按z分组。
x = df['ColumnA']
y = df['ColumnB']
fig, ax = plt.subplots(figsize=(20, 10))
for key, grp in df.groupby(['ColumnC']):
    plt.plot(grp['ColumnA'], grp['ColumnB'].rolling(window=30).mean(), label=key)
我还想从将要绘制的值总数中突出说明两个特定的值:
ax.legend(('Value1', 'Value2'))
plt.show()
这个很好用。我只是在我的图例中有两个值,但所有的值实际上都是绘制的。我真正想要的是,能够为上面的两个值指定颜色。即红色和蓝色,并将C列中的所有其他值显示为一种颜色。其目的是强调价值1和2与其他事物相比是如何表现的。
回答 1
Stack Overflow用户
回答已采纳
发布于 2020-07-22 20:03:24
首先,改变感兴趣的线条的颜色。
lines_to_highlight = {
    'Value1': 'red',
    'Value2': 'blue'
}
DEFAULT_COLOR = 'gray'

legend_entries = []  # Lines to show in legend

for line in ax.lines:
    if line.get_label() in lines_to_highlight:
        line.set_color(lines_to_highlight[line.get_label()])

        legend_entries.append(line)
    else:
        line.set_color(DEFAULT_COLOR)
第二,创造你的传奇。
ax.legend(
    legend_entries,
    [entry.get_label() for entry in legend_entries]
)
备注:
ax.legend(('Value1', 'Value2'))不做你想做的事。它只是重置你画的前两行的标签。它不限制图例仅限于用这些标签创建的行。( matplotlib文档自己说这个错误很容易犯。)- 在设置线条颜色后,必须调用
ax.legend(...)。否则,传说中的颜色可能与情节中的颜色不匹配。
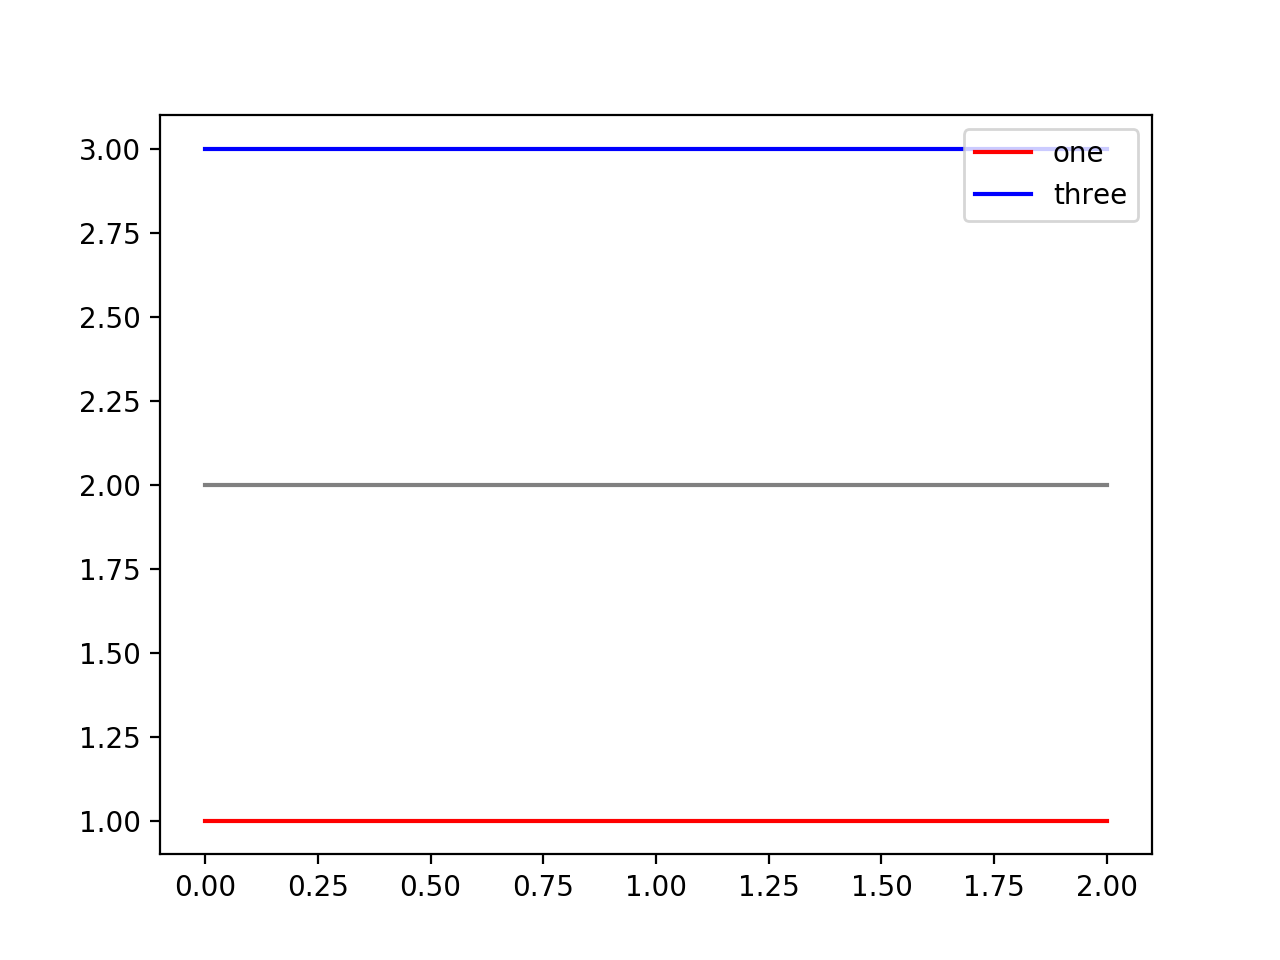
示例
import matplotlib.pyplot as plt

ax = plt.subplot(111)
ax.plot([1, 1, 1], label='one')
ax.plot([2, 2, 2], label='two')
ax.plot([3, 3, 3], label='three')

lines_to_highlight = {
    'one': 'red',
    'three': 'blue'
}
DEFAULT_COLOR = 'gray'

legend_entries = []  # Lines to show in legend

for line in ax.lines:
    if line.get_label() in lines_to_highlight:
        line.set_color(lines_to_highlight[line.get_label()])

        legend_entries.append(line)
    else:
        line.set_color(DEFAULT_COLOR)

ax.legend(
    legend_entries, [entry.get_label() for entry in legend_entries]
)
plt.show()
页面原文内容由Stack Overflow提供。腾讯云小微IT领域专用引擎提供翻译支持
原文链接:
https://stackoverflow.com/questions/63041469
复制相关文章
相似问题
腾讯云开发者

Copyright © 2013 - 2026 Tencent Cloud. All Rights Reserved. 腾讯云 版权所有
深圳市腾讯计算机系统有限公司 ICP备案/许可证号:粤B2-20090059 ![]() 粤公网安备44030502008569号
粤公网安备44030502008569号
腾讯云计算(北京)有限责任公司 京ICP证150476号 | 京ICP备11018762号