
Matlab IoSR统计盒-晶须显示分位数错误?
我在Matlab中有一些数据,我想用一个方格图来绘制。由于标准的盒图无法自定义,所以我决定使用IoSR统计工具箱中的IoSR函数。我希望方框有显示0.025分位数和0.975分位数的晶须,而盒子本身则显示中间四分位数范围和中位数(这是默认的)。例如,典型的数据集是
p = [60.1 93 135.2 69 107.1 98.4 118.9 83.9 67 74.5 102.5 120.8 103.7 114.3 102.4 139.9 110.4 119.3 105.1 79.8 222.7 185.3 76.4 100.2 61.2 131.6 87.2 96 113.3 52.9 78.5 163.3 65.4 64.4];我用标准的Matlab方法prctile()计算了0.025分位数和0.975分位数,以及盒图方法应该使用的工具箱quantile()的分位数函数,得到了完全相同的结果:
prctile(p,2.5,2) -> ans = 55.4200
prctile(p,97.5,2) -> ans = 209.6100
iosr.statistics.quantile(p,0.025,2,'R-5') -> ans = 55.4200
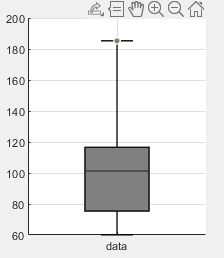
iosr.statistics.quantile(p,0.975,2,'R-5') -> ans = 209.6100然而,当我用下面的代码创建一个盒子图时,我会得到一些太短的胡须。上面的晶须结束在185.3,而不是209.61,下胡须延伸到60.1,而不是55.42。晶须现在正好结束于数据集的第二大/最小值,而人工计算的分位数似乎利用某种插值方案来得到它们的值。
我在这里出什么错了?如何获得框图以显示与手工计算相同的分位数?
iosr.statistics.boxPlot(["data"],p'...
    ,'limit',[2.5, 97.5],'boxColor',[0.5 0.5 0.5],'lineColor','k'...
    ,'medianColor',[0.2 0.2 0.2],'method','R-5','showOutliers',false...
    ,'xspacing','equal')
回答 1
Stack Overflow用户
发布于 2020-08-05 23:10:02
实际上,prctile函数使用内插用于计算精确的百分位值。
同时,根据源代码的IoSR框图函数:
the whiskers extend to the most extreme data that are not considered outliers
因此,选项'limit'并没有设置晶须直接结束的位置,而是标记异常值的位置。
我去了这里,用你的示例数据来确认它。,红线是你想要的分位数值,蓝色的点是你的数据。我已经标记了最远的数据点,果然,这就是你的胡须结束的地方。
至于如何让它显示所需的百分位标记,我不确定,因为我没有工具箱,但我建议您查看它们添加百分位数的选项;请参阅帮助或文档?(不确定文件在何处)可能的相关选项包括:
%       addPrctiles         - Show additional percentiles using markers and
%                             labels. The property should be a vector of
%                             percentiles; each percentile will be plotted
%                             for each box. The property is empty by
%                             default.
...
%       addPrctilesLabels   - Specify labels for the additional
%                             percentiles. The property should be a cell
%                             array of strings. By defualt no label
%                             is shown.
%       addPrctilesMarkers  - Specify markers for the additional
%                             percentiles. The property should be a cell
%                             array of strings indicating the shape of each
%                             percentile; the markers will be repeated for
%                             each box. The default is '*'.
或者,您可以直接使用对象句柄操作晶须:
%       handles             - Structure containing handles to the various
%                             objects that constitute the plot. The
%                             fields/handles are:
%                                 'axes'            : the parent axes of
%                                                     the box plot
%                                 'fig'             : the parent figure of
%                                                     the box plot
%                                 'addPrctiles'     : chart line objects
%                                                     for each additional
%                                                     percentile marker
%                                 'addPrctilesTxt'  : text objects for each
%                                                     additional percentile
%                                                     marker
...
%                                 'upperWhiskers'   : line objects for each
%                                                     upper whisker line
%                                 'lowerWhiskers'   : line objects for each
%                                                     lower whisker line
%                                 'upperWhiskerTips': line objects for each
%                                                     upper whisker tip
%                                 'lowerWhiskerTips': line objects for each
通过可能地使用如下语法:
h = iosr.statistics.boxPlot(["data"],p',...)
h.upperWhiskers = % XY coordinates for desired line
h.lowerWhiskers = % XY coordinates for desired linehttps://stackoverflow.com/questions/63272684
复制相似问题
腾讯云开发者

Copyright © 2013 - 2026 Tencent Cloud. All Rights Reserved. 腾讯云 版权所有
深圳市腾讯计算机系统有限公司 ICP备案/许可证号:粤B2-20090059 ![]() 粤公网安备44030502008569号
粤公网安备44030502008569号
腾讯云计算(北京)有限责任公司 京ICP证150476号 | 京ICP备11018762号