
QPieChart图例和百分比标签
QPieChart图例和百分比标签
提问于 2020-08-07 18:43:45
在QPieChart中是否可以将百分比显示为圆圈上的标签和图例中的字符串?
这是我的代码作为一个例子
from PyQt5 import QtCore, QtGui, QtWidgets, QtChart
from PyQt5.QtWidgets import QApplication, QMainWindow
import sys
from PyQt5.QtChart import QChart, QChartView, QPieSeries, QPieSlice
from PyQt5.QtGui import QPainter, QPen
from PyQt5.QtCore import Qt

class Window(QMainWindow):
    def __init__(self):
        super().__init__()

        self.setWindowTitle("PyQtChart Pie Chart")
        self.setGeometry(100,100, 1280,600)

        self.show()
        self.create_piechart()

    def create_piechart(self):
        series = QtChart.QPieSeries()
        series.append("Python", 80)
        series.append("C++", 70)
        series.append("Java", 50)
        series.append("C#", 40)
        series.append("PHP", 30)
        series.setLabelsVisible(True)
        series.setLabelsPosition(QtChart.QPieSlice.LabelOutside)
        for slice in series.slices():
            slice.setLabel("{:.2f}%".format(100 * slice.percentage()))

        chart = QChart()
        chart.legend()
        chart.addSeries(series)
        chart.createDefaultAxes()
        chart.setAnimationOptions(QChart.SeriesAnimations)
        chart.setTitle("Pie Chart Example")

        chart.legend().setVisible(True)
        chart.legend().setAlignment(Qt.AlignBottom)
        chartview = QChartView(chart)
        chartview.setRenderHint(QPainter.Antialiasing)

        self.setCentralWidget(chartview)
App = QApplication(sys.argv)
window = Window()
sys.exit(App.exec_())回答 1
Stack Overflow用户
回答已采纳
发布于 2020-08-09 13:30:07
为了在饼图上显示百分比,需要更改QPieSeries。
更改标签位置
series.setLabelsPosition(QtChart.QPieSlice.LabelOutside)到series.setLabelsPosition(QtChart.QPieSlice.LabelInsideHorizontal)
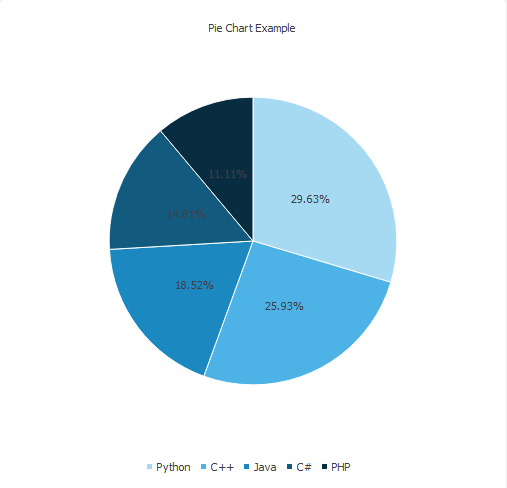
在此之后,图例标签也是百分比。更改图例标签修改图例标记
chart.legend().markers(series)[0].setLabel("Python")
chart.legend().markers(series)[1].setLabel("C++")
chart.legend().markers(series)[2].setLabel("Java")
chart.legend().markers(series)[3].setLabel("C#")
chart.legend().markers(series)[4].setLabel("PHP")
结果:
链接到文档
全码
from PyQt5 import QtChart
from PyQt5.QtWidgets import QApplication, QMainWindow
import sys
from PyQt5.QtChart import QChart, QChartView
from PyQt5.QtGui import QPainter
from PyQt5.QtCore import Qt


class Window(QMainWindow):
    def __init__(self):
        super().__init__()

        self.setWindowTitle("PyQtChart Pie Chart")
        self.setGeometry(100, 100, 1280, 600)

        self.show()
        self.create_piechart()

    def create_piechart(self):
        series = QtChart.QPieSeries()
        series.append("Python", 80)
        series.append("C++", 70)
        series.append("Java", 50)
        series.append("C#", 40)
        series.append("PHP", 30)
        series.setLabelsVisible(True)


        series.setLabelsPosition(QtChart.QPieSlice.LabelInsideHorizontal)
        for slice in series.slices():
            slice.setLabel("{:.2f}%".format(100 * slice.percentage()))

        chart = QChart()
        chart.addSeries(series)
        chart.createDefaultAxes()
        chart.setAnimationOptions(QChart.SeriesAnimations)
        chart.setTitle("Pie Chart Example")
        chart.legend().setVisible(True)
        chart.legend().setAlignment(Qt.AlignBottom)

        chart.legend().markers(series)[0].setLabel("Python")
        chart.legend().markers(series)[1].setLabel("C++")
        chart.legend().markers(series)[2].setLabel("Java")
        chart.legend().markers(series)[3].setLabel("C#")
        chart.legend().markers(series)[4].setLabel("PHP")

        chartview = QChartView(chart)
        chartview.setRenderHint(QPainter.Antialiasing)

        self.setCentralWidget(chartview)


if __name__ == '__main__':
    App = QApplication(sys.argv)
    window = Window()
sys.exit(App.exec_())页面原文内容由Stack Overflow提供。腾讯云小微IT领域专用引擎提供翻译支持
原文链接:
https://stackoverflow.com/questions/63307586
复制相关文章
相似问题
腾讯云开发者

Copyright © 2013 - 2026 Tencent Cloud. All Rights Reserved. 腾讯云 版权所有
深圳市腾讯计算机系统有限公司 ICP备案/许可证号:粤B2-20090059 ![]() 粤公网安备44030502008569号
粤公网安备44030502008569号
腾讯云计算(北京)有限责任公司 京ICP证150476号 | 京ICP备11018762号