
用Plotnine拟合非线性曲线
用Plotnine拟合非线性曲线
提问于 2020-08-10 16:57:08
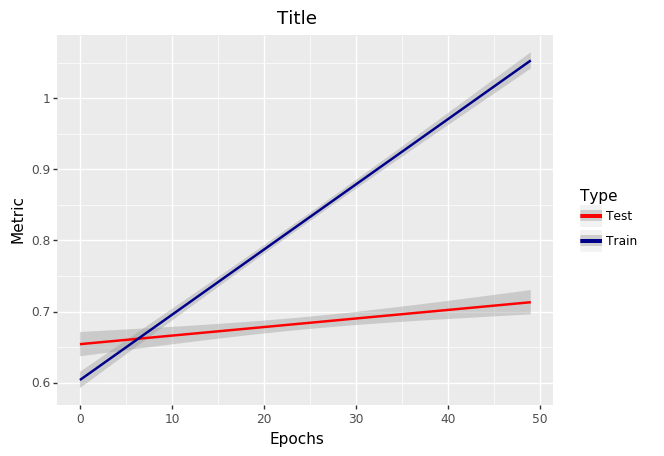
下面是一个用于为用户定义的度量标准生成线性曲线的工作示例。
。
我怎样才能把它拟合成非线性曲线呢?
def plot(version, str_metric):
  metric1 = [0.459, 0.5844, 0.6246, 0.6459, 0.6429, 0.6629, 0.664, 0.6722, 0.6832, 0.6931, 0.7103, 0.7144, 0.7213, 0.716, 0.7182, 0.7419, 0.7418, 0.7594, 0.7639, 0.7854, 0.7752, 0.7912, 0.8164, 0.8311,
             0.8283, 0.8103, 0.869, 0.8708, 0.884, 0.9017, 0.9248, 0.9233, 0.9432, 0.9306, 0.945, 0.959, 0.9675, 0.9649, 0.982, 0.9276, 0.975, 0.9772, 0.9786, 0.988, 0.9825, 0.9901, 0.9934, 0.993, 0.9956, 0.9951]
  metric2 = [0.4541, 0.5807, 0.6138, 0.6339, 0.6322, 0.63, 0.6451, 0.6514, 0.6589, 0.6597, 0.6759, 0.6817, 0.6866, 0.6803, 0.6819, 0.7009, 0.7039, 0.7162, 0.7197, 0.7237, 0.7145, 0.7239, 0.7416, 0.7426,
             0.7461, 0.7054, 0.7495, 0.7331, 0.7316, 0.7023, 0.7232, 0.7359, 0.7257, 0.7178, 0.6918, 0.7118, 0.7183, 0.6939, 0.6855, 0.6874, 0.6745, 0.6952, 0.6491, 0.6659, 0.6624, 0.6737, 0.6587, 0.653, 0.6485, 0.6854]

  epochs = [i for i in range(len(metric1))]

  color_dict = {'SGD_Train': 'darkblue',
                'SGD_Test': 'red'}

  df = pd.DataFrame({'Epochs': np.hstack([epochs, epochs]),
                     str_metric: np.hstack([metric1, metric2]),
                     'Type': np.repeat(['SGD_Train', 'SGD_Test'], len(epochs))})
  pdb.set_trace()
  p = ggplot(df, aes(x='Epochs', y=str_metric, color='Type')) +\
      geom_smooth(show_legend=True, method='lm',
                  span=0.10, se=True, level=0.80) +\
      ggtitle(version) +\
      scale_color_manual(values=color_dict) +\
      theme(text=element_text(size=25), legend_box_margin=1, legend_title=element_text(size=23), legend_position=(0.77, 0.5), legend_text=element_text(size=20), legend_box_background=element_rect(fill='transparent')) +\
theme(plot_title=element_text(margin={'t': -15, 'b': -20}))非线性曲线很容易,当数据值更多时,我只需将lm更改为loess并使其工作。但这里的数据条目较少。而且,我无法使stat_smooth方法工作。我试着做以下几件事:
stat_smooth(method='wls', method_args={'start': list(a=1, b=1), formula='y~a*x^b'}, se=True)任何帮助都将不胜感激。
回答 1
Stack Overflow用户
回答已采纳
发布于 2020-08-11 13:05:44
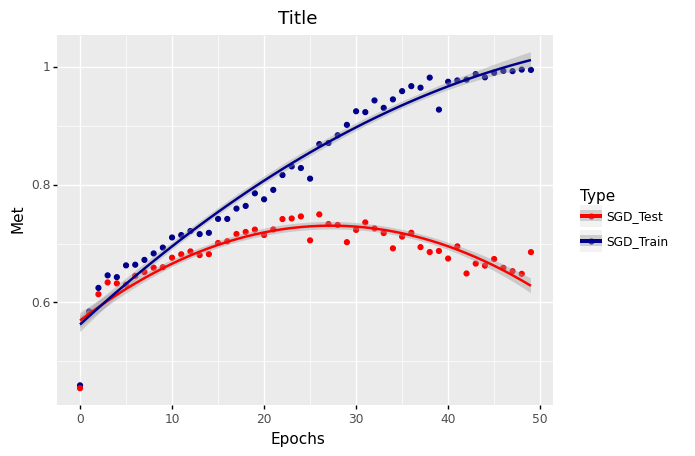
公式接口是有限的,因为没有愚蠢的方法来使用非美观的变量,例如公式a和b中的公式y ~ a*x^b。最好使用外部函数来计算交互。例如,请参阅下面的poly函数(注意下面doc字符串中的警告)。
import pandas as pd
import numpy as np
from plotnine import *

version = 'Title'
str_metric = 'Met'
metric1 = [0.459, 0.5844, 0.6246, 0.6459, 0.6429, 0.6629, 0.664, 0.6722, 0.6832, 0.6931, 0.7103, 0.7144, 0.7213, 0.716, 0.7182, 0.7419, 0.7418, 0.7594, 0.7639, 0.7854, 0.7752, 0.7912, 0.8164, 0.8311,
         0.8283, 0.8103, 0.869, 0.8708, 0.884, 0.9017, 0.9248, 0.9233, 0.9432, 0.9306, 0.945, 0.959, 0.9675, 0.9649, 0.982, 0.9276, 0.975, 0.9772, 0.9786, 0.988, 0.9825, 0.9901, 0.9934, 0.993, 0.9956, 0.9951]
metric2 = [0.4541, 0.5807, 0.6138, 0.6339, 0.6322, 0.63, 0.6451, 0.6514, 0.6589, 0.6597, 0.6759, 0.6817, 0.6866, 0.6803, 0.6819, 0.7009, 0.7039, 0.7162, 0.7197, 0.7237, 0.7145, 0.7239, 0.7416, 0.7426,
         0.7461, 0.7054, 0.7495, 0.7331, 0.7316, 0.7023, 0.7232, 0.7359, 0.7257, 0.7178, 0.6918, 0.7118, 0.7183, 0.6939, 0.6855, 0.6874, 0.6745, 0.6952, 0.6491, 0.6659, 0.6624, 0.6737, 0.6587, 0.653, 0.6485, 0.6854]

epochs = [i for i in range(len(metric1))]

color_dict = {'SGD_Train': 'darkblue',
              'SGD_Test': 'red'}

df = pd.DataFrame({'Epochs': np.hstack([epochs, epochs]),
                 str_metric: np.hstack([metric1, metric2]),
                 'Type': np.repeat(['SGD_Train', 'SGD_Test'], len(epochs))})

def poly(x, degree=1):
    """
    Fit Polynomial

    These are non orthogonal factors, but it may not matter if
    we only need this for smoothing and not extrapolated
    predictions.
    """
    d = {}
    for i in range(degree+1):
        if i == 1:
            d['x'] = x
        else:
            d[f'x**{i}'] = np.power(x, i)
    return pd.DataFrame(d)


(ggplot(df, aes(x='Epochs', y=str_metric, color='Type'))
 + geom_point()
 + stat_smooth(
     method='lm',
     formula='y ~ poly(x, degree=2)',
     span=0.10,
     se=True,
     level=0.80
 )
 + ggtitle(version)
 + scale_color_manual(values=color_dict)
)
页面原文内容由Stack Overflow提供。腾讯云小微IT领域专用引擎提供翻译支持
原文链接:
https://stackoverflow.com/questions/63344621
复制相关文章
相似问题
腾讯云开发者

Copyright © 2013 - 2026 Tencent Cloud. All Rights Reserved. 腾讯云 版权所有
深圳市腾讯计算机系统有限公司 ICP备案/许可证号:粤B2-20090059 ![]() 粤公网安备44030502008569号
粤公网安备44030502008569号
腾讯云计算(北京)有限责任公司 京ICP证150476号 | 京ICP备11018762号