
如何在ggplot2中的图例周围添加一个框?
如何在ggplot2中的图例周围添加一个框?
提问于 2020-08-21 04:13:15
使用下面的脚本,我如何添加像下图这样的底部图例框?
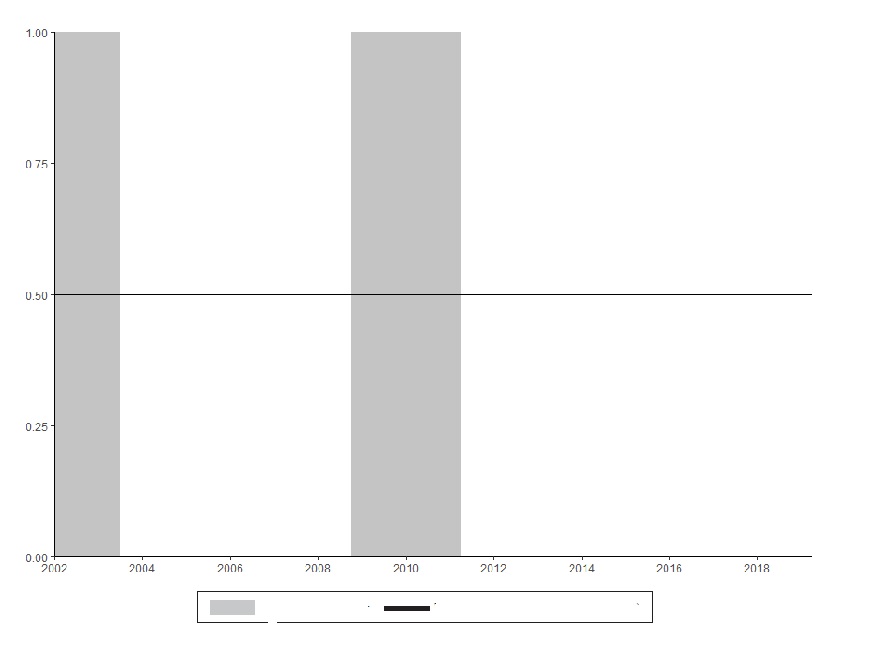
start <- c('2002 Q1', '2008 Q4')
end <- c('2003 Q3', '2011 Q2')

dates <- as.yearqtr(seq(as.Date('2002-01-01'), as.Date('2019-06-01'), by='quarter'))

cod <- tibble(start = as.yearqtr(start), end = as.yearqtr(end)) %>%
  filter(start %in% dates) %>%
  mutate(start = as.Date(start)) %>%
  mutate(end = as.Date(end))

dates <- as.Date(dates)

tbl_fz <- tibble(x = dates, fz = 0.5)

plot <- ggplot(data = tbl_fz) +
  geom_rect(data = cod, aes(xmin = start, xmax = end,
                            ymin = 0, ymax = 1, fill = "b"), alpha = 0.9) +
  geom_line(aes(x = x, y = fz), size = 0.5) +
  ggtitle('') +
  theme_classic() +
  theme(title = element_text(size = 8),
        plot.title = element_text(hjust = 0.5),
        legend.position = c(0.5, -0.5)) +
  ylab('') +
  xlab('') +
  scale_x_date(date_breaks = '2 year', date_labels = '%Y',
               expand = c(0, 0)) +
  scale_y_continuous(expand = c(0,0)) +
  scale_fill_manual(name = 'kkkk',
                    values = c('grey'),
                    labels = c('kkkk'))

plot回答 1
Stack Overflow用户
回答已采纳
发布于 2020-08-21 06:51:24
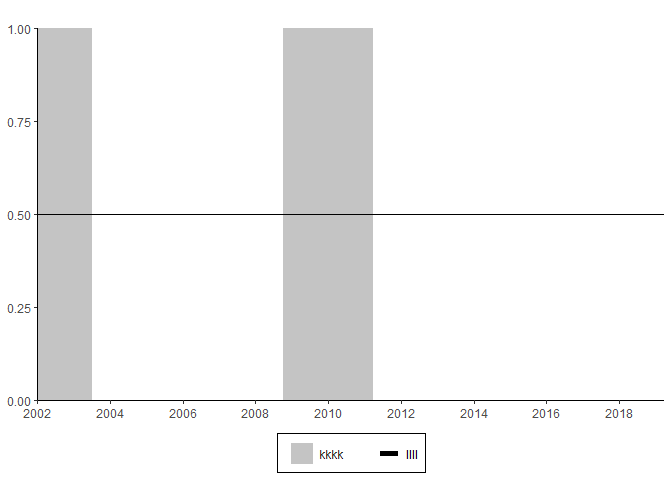
这是可以做到的。要将图例放在底部,我建议使用legend.position = "bottom"。要将这一行添加到图例中,可以在color aes上映射一些内容,并使用scale_color_manual,就像您为fill aes所做的那样。要想在图例中找到一个盒子,请使用legend.box.background = element_rect(color = "black")。我还在顶部和左边加上了一些空白处,因为盒子是部分覆盖的。最后,为了使传说的顺序正确,例如,为了得到更厚的线条,您可以使用guide_legend来对传奇进行样式化。
# Packages ----------------------------------------------------------------
library(dplyr)
library(ggplot2)
library(zoo)


start <- c('2002 Q1', '2008 Q4')
end <- c('2003 Q3', '2011 Q2')

dates <- as.yearqtr(seq(as.Date('2002-01-01'), as.Date('2019-06-01'), by='quarter'))

cod <- tibble(start = as.yearqtr(start), end = as.yearqtr(end)) %>%
  filter(start %in% dates) %>%
  mutate(start = as.Date(start)) %>%
  mutate(end = as.Date(end))

dates <- as.Date(dates)

tbl_fz <- tibble(x = dates, fz = 0.5)

plot <- ggplot(data = tbl_fz) +
  geom_rect(data = cod, aes(xmin = start, xmax = end,
                            ymin = 0, ymax = 1, fill = "b"), alpha = 0.9) +
  geom_line(aes(x = x, y = fz, color = "c"), size = 0.5) +
  ggtitle('') +
  theme_classic() +
  theme(title = element_text(size = 8),
        plot.title = element_text(hjust = 0.5),
        legend.position = "bottom",
        legend.box.background = element_rect(color = "black"),
        legend.box.margin = margin(t = 1, l = 1)) +
  scale_x_date(date_breaks = '2 year', date_labels = '%Y',
               expand = c(0, 0)) +
  scale_y_continuous(expand = c(0,0)) +
  scale_fill_manual(values = c('grey'), labels = c('kkkk'))+
  scale_color_manual(values = c('black'), labels = c('llll')) +
  labs(x = NULL, y = NULL, fill = NULL, color = NULL) +
  guides(fill = guide_legend(order = 1), color = guide_legend(order = 2, override.aes = list(size = 2)))

plot
页面原文内容由Stack Overflow提供。腾讯云小微IT领域专用引擎提供翻译支持
原文链接:
https://stackoverflow.com/questions/63516423
复制相关文章
相似问题
腾讯云开发者

Copyright © 2013 - 2026 Tencent Cloud. All Rights Reserved. 腾讯云 版权所有
深圳市腾讯计算机系统有限公司 ICP备案/许可证号:粤B2-20090059 ![]() 粤公网安备44030502008569号
粤公网安备44030502008569号
腾讯云计算(北京)有限责任公司 京ICP证150476号 | 京ICP备11018762号