
高图水平叠加漏斗图
高图水平叠加漏斗图
提问于 2020-09-08 10:03:51
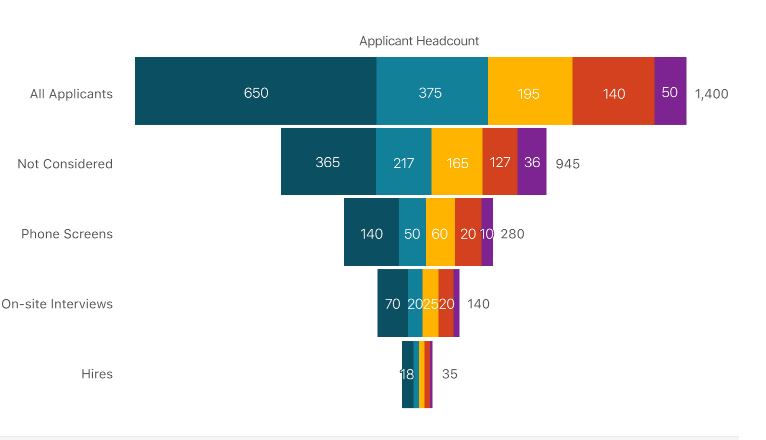
我们想要一个像这样的可视化,用高海图&角度。有人能帮我的实现,我也在努力,一旦我得到它,我会更新我的答案,只是想看看是否有人可以帮助我做得更快。
回答 1
Stack Overflow用户
发布于 2020-09-08 10:35:14
我认为您应该使用columnrange系列来实现想要的结果-- https://www.highcharts.com/demo/columnrange。
您可以开始的基本尝试:https://jsfiddle.net/BlackLabel/h5v7czmt/
Highcharts.chart('container', {

  chart: {
    type: 'columnrange',
    inverted: true
  },

    yAxis: {
        visible: false
    },

    xAxis: {
        categories: ['All Applicants', 'Not Considered']
    },

  plotOptions: {
    series: {
      stacking: 'normal',
            showInLegend: false
    }
  },

  series: [{
    name: 'test1',
    data: [
      [0, 650],
            [285, 650]
    ]
  }, {
    name: 'test2',
    data: [
      [650, 1025],
            [650, 867]
    ]
  }, {
        name: 'test3',
        data: [
            [1025, 1220],
            [867, 1032]
        ]
    }]

});
和高级图表的API角包装器- https://github.com/highcharts/highcharts-angular
页面原文内容由Stack Overflow提供。腾讯云小微IT领域专用引擎提供翻译支持
原文链接:
https://stackoverflow.com/questions/63791600
复制相关文章
相似问题
腾讯云开发者

Copyright © 2013 - 2026 Tencent Cloud. All Rights Reserved. 腾讯云 版权所有
深圳市腾讯计算机系统有限公司 ICP备案/许可证号:粤B2-20090059 ![]() 粤公网安备44030502008569号
粤公网安备44030502008569号
腾讯云计算(北京)有限责任公司 京ICP证150476号 | 京ICP备11018762号