
在metpy中抑制打印轴标签
在metpy中抑制打印轴标签
提问于 2020-09-10 19:00:53
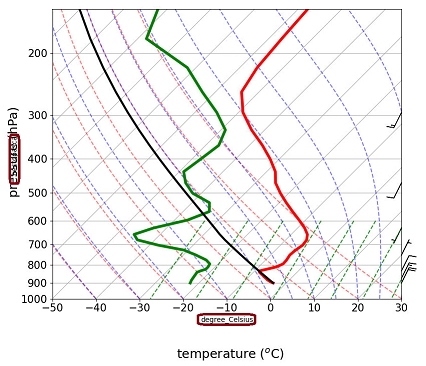
我正在使用SkewT生成MetPy图。我试图抑制轴标签的自动生成,并使用我自己的。自动标签生成的是面积和degree_Celsius.I找不到方法禁用自动轴标签,所以最终的结果是一个混乱的外观。不想要的自动生成的标签用泥泞的红色圈起来:
我试着把它们关掉
plt.axis('off')但是它不仅去掉了标签,还去掉了勾号和所有的东西,甚至是地块周围的边框。
我试着变得更有创意
plt.gca().axes.yaxis.set_label([])或
skew.ax.xaxis.set_label([])但这两种方法都没有用。我试图删除标签的其他东西也删除了滴答值。
我知道我可能遗漏了一些简单的东西,但我似乎找不到它。
下面是一个示例代码,它使用来自SkewT的一个稍微修改过的MetPy绘图示例演示了这一点:
import matplotlib.pyplot as plt
import numpy as np
import metpy.calc as mpcalc
from metpy.plots import SkewT
from metpy.units import units

fig = plt.figure(figsize=(9, 9))
skew = SkewT(fig, rotation=45)

# Create arrays of pressure, temperature, dewpoint, and wind components
p = [902, 897, 893, 889, 883, 874, 866, 857, 849, 841, 833, 824, 812, 796, 776, 751,
     727, 704, 680, 656, 629, 597, 565, 533, 501, 468, 435, 401, 366, 331, 295, 258,
     220, 182, 144, 106] * units.hPa
t = [-3, -3.7, -4.1, -4.5, -5.1, -5.8, -6.5, -7.2, -7.9, -8.6, -8.9, -7.6, -6, -5.1,
     -5.2, -5.6, -5.4, -4.9, -5.2, -6.3, -8.4, -11.5, -14.9, -18.4, -21.9, -25.4,
     -28, -32, -37, -43, -49, -54, -56, -57, -58, -60] * units.degC
td = [-22, -22.1, -22.2, -22.3, -22.4, -22.5, -22.6, -22.7, -22.8, -22.9, -22.4,
      -21.6, -21.6, -21.9, -23.6, -27.1, -31, -38, -44, -46, -43, -37, -34, -36,
      -42, -46, -49, -48, -47, -49, -55, -63, -72, -88, -93, -92] * units.degC

# Calculate parcel profile
prof = mpcalc.parcel_profile(p, t[0], td[0]).to('degC')
u = np.linspace(-10, 10, len(p)) * units.knots
v = np.linspace(-20, 20, len(p)) * units.knots

skew.plot(p, t, 'r', linewidth=4)
skew.plot(p, td, 'g', linewidth=4)
skew.plot(p, prof, 'k', linewidth=3)  # Plot parcel profile
skew.plot_barbs(p[::5], u[::5], v[::5])

skew.ax.set_xlim(-50, 30)
skew.ax.set_ylim(1000, 150)
skew.ax.xaxis.set_tick_params(which='major', labelsize=15, direction='out')
skew.ax.yaxis.set_tick_params(which='major', labelsize=15, direction='out')

#THIS DIDN'T WORK
#skew.ax.xaxis.set_label([])

# Add the relevant special lines
skew.plot_dry_adiabats()
skew.plot_moist_adiabats()
skew.plot_mixing_lines()

# Labels
fig.text(0.52,0.05, "temperature ($^{o}$C)", ha="center", va="center", fontsize=18)
fig.text(0.04,0.5, "pressure (hPa)", ha="center", va="center", rotation=90, fontsize=18)

plt.show()
谢谢
回答 1
Stack Overflow用户
回答已采纳
发布于 2020-09-10 20:37:03
所以你要找的函数是set_xlabel或set_ylabel
# Clear out the default labels
skew.ax.set_xlabel('')
skew.ax.set_ylabel('')如果您真的想在.xaxis和.yaxis上使用这些方法,则如下所示:
skew.ax.xaxis.set_label_text('')
skew.ax.yaxis.set_label_text('')我还想指出,您不仅需要清除标签,还应该能够使用这些方法来实现您使用fig.text所做的工作
# Use \N for named unicode character
skew.ax.set_xlabel('temperature (\N{DEGREE CELSIUS})',
                   fontdict=dict(size=18))
skew.ax.set_ylabel('pressure (hPa)', fontdict=dict(size=18))页面原文内容由Stack Overflow提供。腾讯云小微IT领域专用引擎提供翻译支持
原文链接:
https://stackoverflow.com/questions/63836126
复制相关文章
相似问题
腾讯云开发者

Copyright © 2013 - 2026 Tencent Cloud. All Rights Reserved. 腾讯云 版权所有
深圳市腾讯计算机系统有限公司 ICP备案/许可证号:粤B2-20090059 ![]() 粤公网安备44030502008569号
粤公网安备44030502008569号
腾讯云计算(北京)有限责任公司 京ICP证150476号 | 京ICP备11018762号