
仅根据不同数据帧中的值来显示特定国家。
仅根据不同数据帧中的值来显示特定国家。
提问于 2020-09-12 08:55:47
我是R领域的初学者,我正试图绘制一张世界地图,它将根据各国人均国内生产总值( GDP )来绘制特定国家的颜色,而后者存储在另一个数据框架中。这是我的代码(在网上找到):
install.packages(c("cowplot", "googleway", "ggplot2", "ggrepel", "ggspatial", "libwgeom", "sf", "rnaturalearth", "rnaturalearthdata", "rgeos"))

library("ggplot2")
theme_set(theme_bw())
library("sf")
library("rnaturalearth")
library("rnaturalearthdata")
library("rgeos")

world <- ne_countries(scale = "medium", returnclass = "sf")

ggplot(data = world) +
geom_sf() +
xlab("Longitude") + ylab("Latitude") +
ggtitle("World map", subtitle = paste0("(", length(unique(world$name)), " countries)"))
这带来了241个国家的地图。然而,我的GDP数据框架只存储了182个国家的信息。因此,在尝试使用FILL=时,我会收到一个错误:
ggplot(data = world) +
geom_sf(aes(fill = GDP.data$`US$`)) +
scale_fill_viridis_c(option = "plasma", trans = "sqrt")
Error: Aesthetics must be either length 1 or the same as the data (241): fill
我怎样才能克服这个问题,并仍然使R颜色的国家,我的数据框架?
非常感谢!
回答 1
Stack Overflow用户
回答已采纳
发布于 2020-09-12 12:32:42
下面是一个工作示例,并遵循@stefan关于将您的数据连接到地图数据框架的建议。
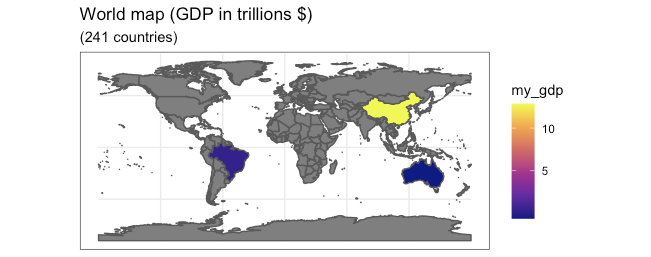
在这个例子中,我创建了一个有限的数据框架,其中包含了一些国家的gdp信息my_gdp:
gdp_data <- data.frame(
  name = c("Australia", "China", "Brazil"),
  my_gdp = c(1.43, 13.61, 1.86)
)

       name my_gdp
1 Australia   1.43
2     China  13.61
3 Brazil 1.86您可以使用merge (或使用dplyr::left_join),以便将my_gdp添加到world数据帧中。使用all.x将确保所有国家仍在筹划,并在没有国内生产总值的情况下填写NA。
plot_data <- merge(world, gdp_data, by = "name", all.x = TRUE)然后,您只使用这个最终的数据框架plot_data来创建您的绘图。这将比在ggplot中引用两个不同的数据帧更容易管理,并确保您有相同数量的数据行用于绘制国家和填充gdp。
ggplot(data = plot_data) +
  geom_sf(aes(fill = my_gdp)) +
  scale_fill_viridis_c(option = "plasma", trans = "sqrt") +
  ggtitle("World map (GDP in trillions $)", subtitle = paste0("(", length(unique(world$name)), " countries)"))
图
页面原文内容由Stack Overflow提供。腾讯云小微IT领域专用引擎提供翻译支持
原文链接:
https://stackoverflow.com/questions/63858603
复制相关文章
相似问题
腾讯云开发者

Copyright © 2013 - 2026 Tencent Cloud. All Rights Reserved. 腾讯云 版权所有
深圳市腾讯计算机系统有限公司 ICP备案/许可证号:粤B2-20090059 ![]() 粤公网安备44030502008569号
粤公网安备44030502008569号
腾讯云计算(北京)有限责任公司 京ICP证150476号 | 京ICP备11018762号