
使用prometheus_client向Prometheus公开包度量
我有两个单独运行以下代码的文件:
sandbox1.py
from prometheus_client import Counter
import time
while True:
    my_counter1 = Counter('my_counter1', 'My counter)
    my_counter1.inc()
    time.sleep(1)
sandbox2.py
from prometheus_client import Counter
import time
while True:
    my_counter2 = Counter('my_counter2', 'My counter)
    my_counter2.inc()
time.sleep(2)有没有一种方法可以使用prometheus_client将my_counter1和my_counter2公开给我的Prometheus服务器?
我已经看过python了,但我不太确定如何将sandbox1.py和sandbox2.py中的指标调用到实际向Prometheus公开这些度量的文件中。度量标准总是必须是同一个文件的一部分吗?
回答 1
Stack Overflow用户
发布于 2020-09-18 17:26:52
Prometheus服务器会刮掉提供度量的HTTP端点。这与其他一些度量系统不同,这些度量被推送到度量系统中。因为Prometheus会擦拭度量端点,所以您需要做两件事:
- 使用HTTP服务器\端点公开来自客户端的度量
- 将Prometheus服务器配置为针对此度量服务器\端点
如果您在引用的页面上运行三步演示示例,然后浏览http://localhost:8000,您应该会看到以下内容:
# HELP python_gc_objects_collected_total Objects collected during gc
# TYPE python_gc_objects_collected_total counter
python_gc_objects_collected_total{generation="0"} 357.0
python_gc_objects_collected_total{generation="1"} 0.0
python_gc_objects_collected_total{generation="2"} 0.0
...
...
# HELP request_processing_seconds Time spent processing request
# TYPE request_processing_seconds summary
request_processing_seconds_count 4.0
request_processing_seconds_sum 2.0374009040533565
# HELP request_processing_seconds_created Time spent processing request
# TYPE request_processing_seconds_created gauge
request_processing_seconds_created 1.6004497426536365e+09这是Prometheus服务器将被配置为刮除的页面。您可以看到,例如提供了python_gc_objects_collected_total计数器。Prometheus指标是人类可读的,这是有用的。
如果组合在一起,您的sandbox1.py将进入下面的示例:
from prometheus_client import start_http_server, Counter, Summary
import random
import time

# Create a metric to track time spent and requests made.
REQUEST_TIME = Summary('request_processing_seconds',
                       'Time spent processing request')


# Decorate function with metric.
@REQUEST_TIME.time()
def process_request(t):
    """A dummy function that takes some time."""
    time.sleep(t)


if __name__ == '__main__':
    my_counter1 = Counter('my_counter1', 'My counter')
    # Start up the server to expose the metrics.
    start_http_server(8000)
    # Generate some requests.
    while True:
        my_counter1.inc()
        process_request(random.random())
然后再次运行代码,现在您应该看到:
# HELP python_gc_objects_collected_total Objects collected during gc
# TYPE python_gc_objects_collected_total counter
python_gc_objects_collected_total{generation="0"} 357.0
python_gc_objects_collected_total{generation="1"} 0.0
python_gc_objects_collected_total{generation="2"} 0.0
...
...
# HELP my_counter1_total My counter
# TYPE my_counter1_total counter
my_counter1_total 13.0
# HELP my_counter1_created My counter
# TYPE my_counter1_created gauge
my_counter1_created 1.6004498408280134e+09注意:页面底部的是
my_counter1_total和my_counter1_created,它们对应于您的my_counter1 = Counter("my_counter1","My counter")
如果您将Prometheus服务器指向此目标(localhost:8000),您应该能够例如绘制my_counter1_total计数器和my_counter1_created量规。
创建一个名为prometheus.yml的文件
global:
  scrape_interval: 15s
  evaluation_interval: 15s

scrape_configs:
  # Self
  - job_name: "prometheus-server"
    static_configs:
      - targets:
          - "localhost:9090"

  # Python example
  - job_name: "63957470"
    static_configs:
      - targets:
          - "localhost:8000"
然后运行普罗米修斯:
docker run \
--interactive --tty \
--net=host \
--volume=${PWD}/prometheus.yml:/etc/prometheus/prometheus.yml \
prom/prometheus@sha256:f3ada803723ccbc443ebea19f7ab24d3323def496e222134bf9ed54ae5b787bd注意这假设
prometheus.yml在工作目录中
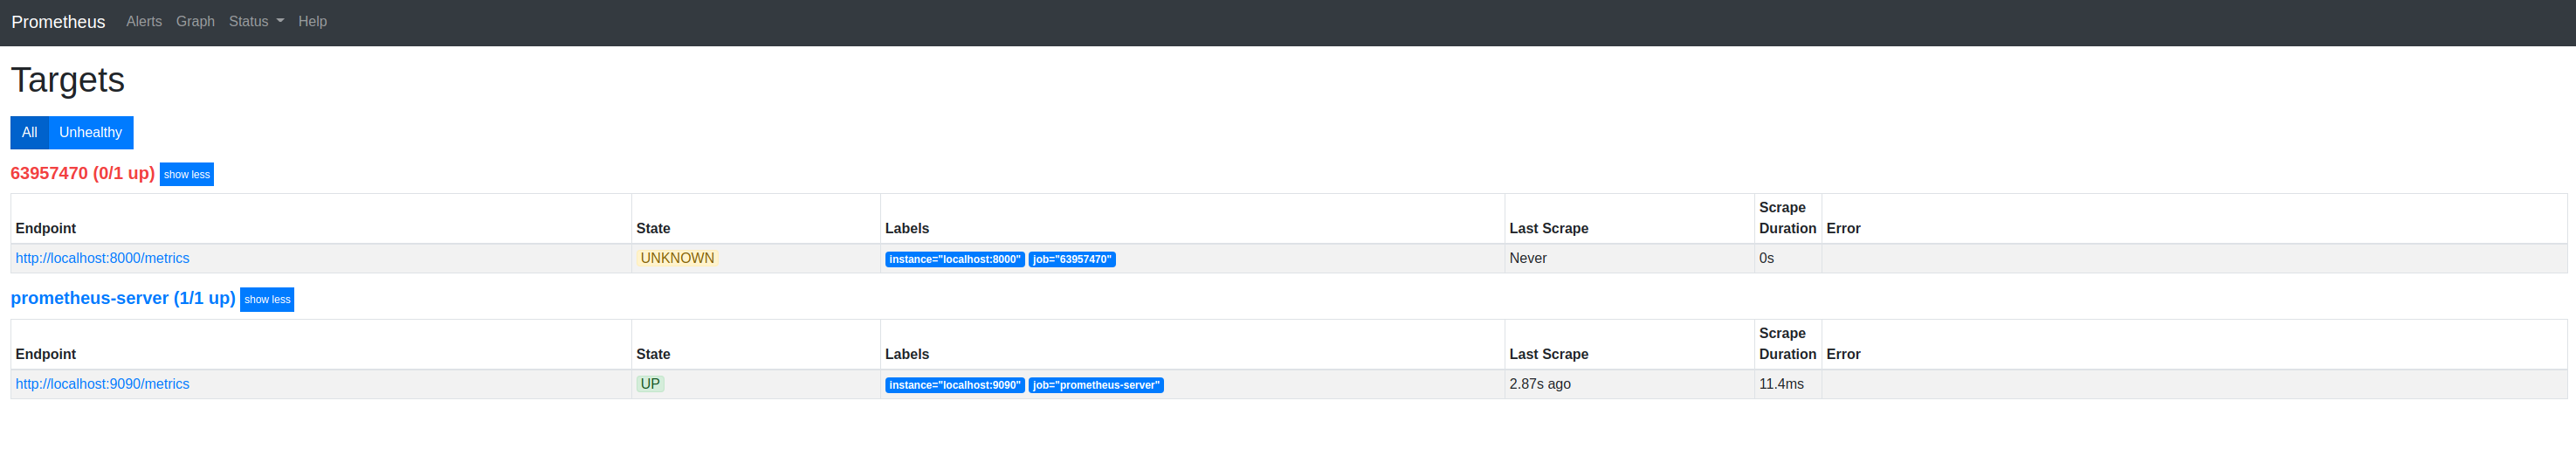
你可以在http://localhost:9090上浏览普罗米修斯
您可以看到您的代码配置为目标:http://localhost:9090/targets
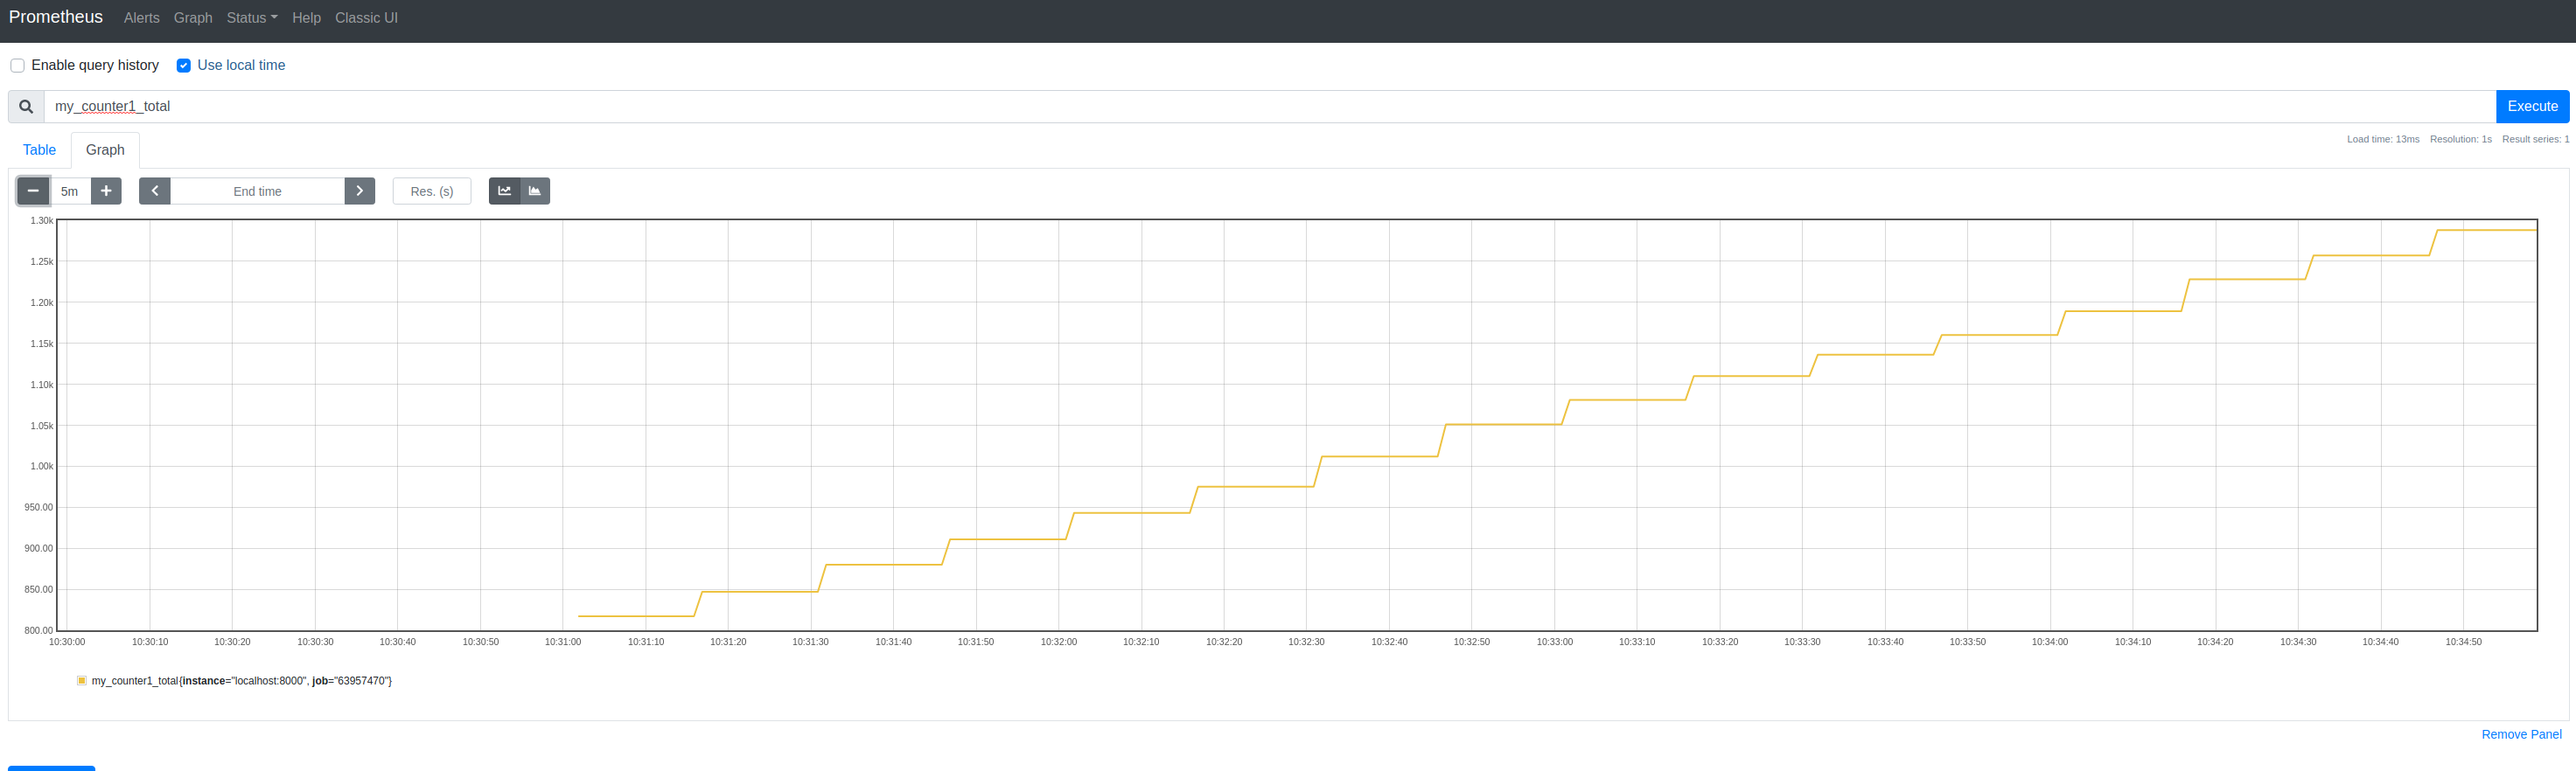
你可以查询你的指标图。输入例如my_counter1_以同时查看两种情况,然后输入计数器的my_counter1_total:
https://stackoverflow.com/questions/63957470
复制相似问题
腾讯云开发者

Copyright © 2013 - 2026 Tencent Cloud. All Rights Reserved. 腾讯云 版权所有
深圳市腾讯计算机系统有限公司 ICP备案/许可证号:粤B2-20090059 ![]() 粤公网安备44030502008569号
粤公网安备44030502008569号
腾讯云计算(北京)有限责任公司 京ICP证150476号 | 京ICP备11018762号