
实时图表绘制问题
实时图表绘制问题
提问于 2020-10-11 08:11:47
我真的很喜欢附图时间序列,但是我遇到了一些问题,所以我希望你们中的一些人能帮我解决这个问题:
- 图表属性被忽略: plotHighlightEffect不工作(鼠标显示图例时没有突出显示,单独行上也没有鼠标突出显示),没有显示Ancors (将属性drawAnchors设置为1没有任何区别)。useMessageLog和showRTMenuItem也不能工作。
- 如何显示图上的所有数据点(而不删除左边最老的数据点)?并定义如下:在当前的实时视图上显示1000个点,其他数据可以滚动到左侧??
。
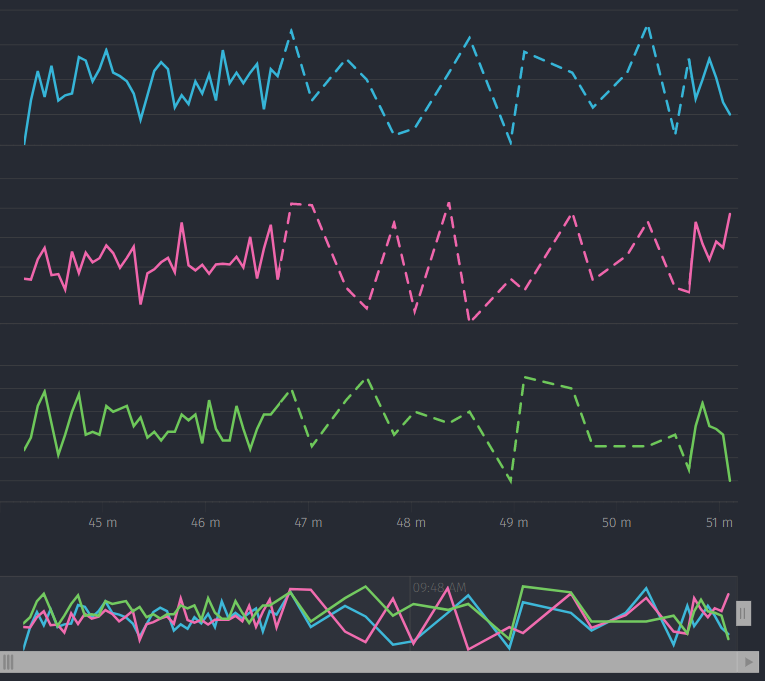
当打开带有图形的浏览器选项卡时,图形正在正常绘制,但当您查看其他选项卡时,图形不喜欢它,并绘制虚线:)如何修复?
const schema = [{
    'name': 'Date',
    'type': 'date',
    'format': '%Y-%m-%d %H:%M:%S'
},{
    'name': 'Current',
    'type': 'number'
},{
    'name': 'Temperature',
    'type': 'number'
},{
    'name': 'Mixer speed',
    'type': 'number'
}];
const chartData = [
    ["2020-10-10 08:59:00","1","20", "40"],
    ["2020-10-10 09:00:00","2","23", "40"],
    ["2020-10-10 09:01:00","4","27", "40"],
    ["2020-10-10 09:02:00","8","31", "40"],
    ["2020-10-10 09:03:00","14","45", "40"],
    ["2020-10-10 09:04:00","14.25","65", "40"],
    ["2020-10-10 09:05:00","14.44","67", "40"],
    ["2020-10-10 09:06:00","16.50","75", "40"],
    ["2020-10-10 09:07:00","18.90","80", "40"],
    ["2020-10-10 09:08:00","17.80","81", "40"],
    ["2020-10-10 09:09:00","15.50","74", "40"],
    ["2020-10-10 09:10:00","14.75","65", "40"],
    ["2020-10-10 09:11:00","14.70","63", "40"]
];

const fusionDataStore = new FusionCharts.DataStore();
const data = fusionDataStore.createDataTable(chartData, schema);

const chartConfigs = {
    type: 'timeseries',
    width: '100%',
    height: '100%',
    dataFormat: 'json',
    renderAt: 'chartContainer',
    dataSource: {
        data: data,
        chart: {
            theme: 'candy',
            plotHighlightEffect: 'fadeout',
            multicanvas: true,
            useMessageLog: "1",
            showRTMenuItem: "1",
            exportenabled: 1,
            exportFormats: 'PDF=Export as PDF|PNG=Export as PNG|SVG=Export as SVG',
            exportfilename: 'smaticGraph_'+(new Date().toLocaleString())
        },
        caption: {
            text: 'Cooking process overview',
            position: 'left'
        },
        subcaption: {
            text: '',
            position: 'left'
        },
        yaxis: [{
                plot: [{
                    value: 'Current',
                    connectnulldata: true,
                    type: 'line'
                }],
                orientation: 'left',
                format: {
                    suffix: ' A'
                }
            },
            {
                plot: [{
                    value: 'Temperature',
                    connectnulldata: true,
                    type: 'line'
                }],
                orientation: 'left',
                format: {
                    suffix: ' °C'
                }
            },
            {
                plot: [{
                    value: 'Mixer speed',
                    connectnulldata: true,
                    type: 'line'
                }],
                orientation: 'left',
                format: {
                    suffix: ' rpm'
                }
            }
        ]
    }
}

var chart = new FusionCharts(chartConfigs);

chart.addEventListener("rendered", function (_ref) {
    var chart = _ref.sender;
    chart.incrementor = setInterval(function () {
        if(chart.feedData){
            chart.feedData([getGraphOverviewData()]);
        }
    }, 1000);
});
chart.addEventListener("disposed", function(eventObj){
    var chartRef = eventObj;
    clearInterval(chartRef.incrementor);
});

chart.render();
谢谢你的帮助。
回答 1
Stack Overflow用户
发布于 2021-06-17 12:23:14
- FusionTime是一个与FusionCharts完全不同和更新的产品,因此目前FusionTime中没有许多FusionCharts功能。您可以在这里找到受支持的属性列表:https://www.fusioncharts.com/dev/fusiontime/fusiontime-attributes#chart-configuration-and-root-json-attributes
您可以设置时间导航器http://jsfiddle.net/srishti_fc/15ztv8er/3/的活动窗口的初始扩展。
"xaxis": {
      "initialInterval": {
        "from": "2020-10-10 09:05:00",
        "to": "2020-10-10 09:11:00"
      }
}- 无法在上面的示例中复制此问题。请复制此问题并共享示例。
页面原文内容由Stack Overflow提供。腾讯云小微IT领域专用引擎提供翻译支持
原文链接:
https://stackoverflow.com/questions/64301893
复制相关文章
相似问题
腾讯云开发者

Copyright © 2013 - 2026 Tencent Cloud. All Rights Reserved. 腾讯云 版权所有
深圳市腾讯计算机系统有限公司 ICP备案/许可证号:粤B2-20090059 ![]() 粤公网安备44030502008569号
粤公网安备44030502008569号
腾讯云计算(北京)有限责任公司 京ICP证150476号 | 京ICP备11018762号