
为什么在处理JVMTI EVENT_EXCEPTION时,JVM有时会崩溃或启动缓慢?
我决定使用JVMTI注册JVM中发生的所有异常,并构建直方图:
ClassName_method_ExceptionName:count
像这样附上的特工:
任务集org.springframework.boot.loader.PropertiesLauncher 10,12 java -agentpath:./jni-agent.so ${JVM_OPTION} -cp module.jar &
我为JNI代理使用了以下代码:
enter code here
#include <stdio.h>
#include <jvmti.h>
#include <jni.h>
#include <map>
#include <string>
#include <cstring>
#include "utils.h"

long excCount;
using namespace std;

map<string, long> mapExceptions;
map<string, long> mapContendedThreadStack;

void mapAddException(map<string,long> &inMap, string key){
    map<string, long> :: iterator it = inMap.find(key);
    if(it == inMap.end()){
        inMap.insert(pair<string, long>(key,1));
        return;
    }
    inMap.find(key)->second ++;
    return;
}
..
..

void JNICALL ExceptionCallback(jvmtiEnv* jvmti, JNIEnv *env, jthread thread, jmethodID method,     jlocation location,
jobject exception, jmethodID catch_method, jlocation catch_location) {
    excCount ++;
    char *class_name;
    jclass exception_class = env->GetObjectClass(exception);
    jvmti->GetClassSignature(exception_class, &class_name, NULL);

    char* method_name;
    jvmti->GetMethodName(method, &method_name, NULL, NULL);
    jclass holder;
    jvmti->GetMethodDeclaringClass(method, &holder);

    char* holder_name;
    jvmti->GetClassSignature(holder, &holder_name, NULL);
    if(strstr(holder_name, "java/lang") != NULL
        || strstr(holder_name, "java/net") != NULL
        || strstr(holder_name, "sun/reflect") != NULL
        || strstr(holder_name, "org/springframework/boot/loader/jar/JarURLConnection") != NULL
        || strstr(holder_name, "okhttp3/internal/connection/RealConnection") != NULL
        || strstr(holder_name, "okio/AsyncTimeout") != NULL ){
            jvmti->Deallocate((unsigned char*) method_name);
            jvmti->Deallocate((unsigned char*) holder_name);
            jvmti->Deallocate((unsigned char*) class_name);
            return;
    }
    string trimres = trimClassName(convertToString(holder_name, strlen(holder_name)));
    char buftotal[1024];
    snprintf(buftotal, sizeof(buftotal) - 1, "%s#%s()_%s", trimres.c_str(), method_name, trimClassName(class_name).c_str());
    replacechar(buftotal, '/', '.');

    //mapAddException(mapExceptions, buftotal);       <-- HERE

    jvmti->Deallocate((unsigned char*) method_name);
    jvmti->Deallocate((unsigned char*) holder_name);
    jvmti->Deallocate((unsigned char*) class_name);
}

extern "C" JNIEXPORT jint JNICALL Agent_OnLoad(JavaVM *vm, char *options, void *reserved) {

    jvmtiCapabilities capabilities;
    jvmtiEventCallbacks callbacks;
    jvmtiEnv *jvmti;

    vm->GetEnv((void **) &jvmti, JVMTI_VERSION_1_0);
    printf("\nNative agent loaded by -agent.....\n");
    capabilities = {0};
    capabilities.can_generate_exception_events = 1;
    jvmti->AddCapabilities(&capabilities);
    callbacks = {0};
    callbacks.Exception = ExceptionCallback;
    jvmti->SetEventCallbacks(&callbacks, sizeof(callbacks));
    jvmti->SetEventNotificationMode(JVMTI_ENABLE, JVMTI_EVENT_EXCEPTION, NULL);
    return 0;
}
带注释行mapAddException(.)JVM启动的时间比没有JNI代理的时间长得多。这样行吗?
我忘了说-这是带有"Hello“的Spring应用程序,一切正常:)
但是当我取消评论mapAddException(.)JVM有时会崩溃。一点也不,有时(50中的2-4 )。
这是从CrashDump中删除的:
..
#  SIGSEGV (0xb) at pc=0x00007f32781bf0b4, pid=47559, tid=0x00007f31e29e1700
#
# JRE version: Java(TM) SE Runtime Environment (8.0_231-b11) (build 1.8.0_231-b11)
# Java VM: Java HotSpot(TM) 64-Bit Server VM (25.231-b11 mixed mode linux-amd64 compressed oops)
# Problematic frame:
# C  [libstdc++.so.6+0x750b4]
..
#
---------------  T H R E A D  ---------------

Current thread (0x00007f3275d82000):  JavaThread "tomcat-thread-16" daemon [_thread_in_native, id=47682, stack(0x00007f31e28e1000,0x00007f31e29e2000)]

siginfo: si_signo: 11 (SIGSEGV), si_code: 1 (SEGV_MAPERR), si_addr: 0x0000000000000010

Registers:
RAX=0x0000000000000000, RBX=0x00007f3190009340, RCX=0x0000000000000001, RDX=0x00007f3274ba0eb0
RSP=0x00007f31e29dc7c8, RBP=0x00007f327414fea0, RSI=0x00007f32786541d0, RDI=0x00007f327414fea0
R8 =0x0000000000000002, R9 =0x0000000000000030, R10=0x000000000000000c, R11=0x00007f327a316f40
R12=0x00007f31a00504f0, R13=0x00007f32786541c8, R14=0x00007f32786541d0, R15=0x00007f3190009340
RIP=0x00007f32781bf0b4, EFLAGS=0x0000000000010283, CSGSFS=0x0000000000000033, ERR=0x0000000000000004
TRAPNO=0x000000000000000e
....
当前线程每次在CrashDump上都是不同的。
回答 1
Stack Overflow用户
发布于 2020-10-22 00:52:01
崩溃的原因很简单:您的代码不安全.
在抛出异常的同一个线程上调用异常回调。如果多个线程并发抛出异常,回调也会被并发调用。std::map并不是线程安全的:并发访问可能导致libstdc++内部崩溃。
慢速的原因更有趣。
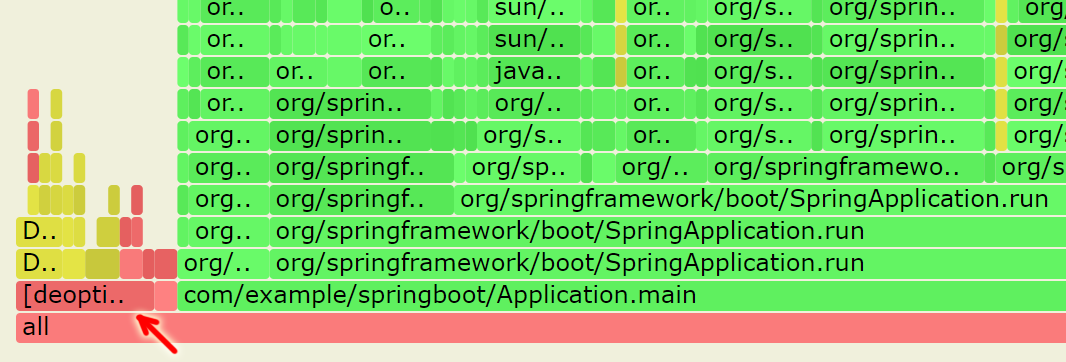
如何分析与JVM和本机交互相关的性能问题?当然是用异步分析器。在分析应用程序启动时,可以方便地将分析器作为代理启动。
java -agentpath:/path/to/libasyncProfiler.so=start,event=cpu,file=out.svg -agentpath:./your-agent.so -cp ...当我和你的经纪人比较时,我注意到一个很大的区别。对于代理,左侧有一个明显的[deoptimization]块:
为什么去优化会发生?异步分析器将再次提供帮助:现在让我们分析一下Deoptimization::deoptimize事件。它实际上不是一个事件,这只是HotSpot JVM中的一个函数名(异步分析器可以跟踪本机函数的调用)。
java -agentpath:/path/to/libasyncProfiler.so=start,event=Deoptimization::deoptimize,file=deopt.svg ...有8000多个去优化事件!这里只是图的一小部分:
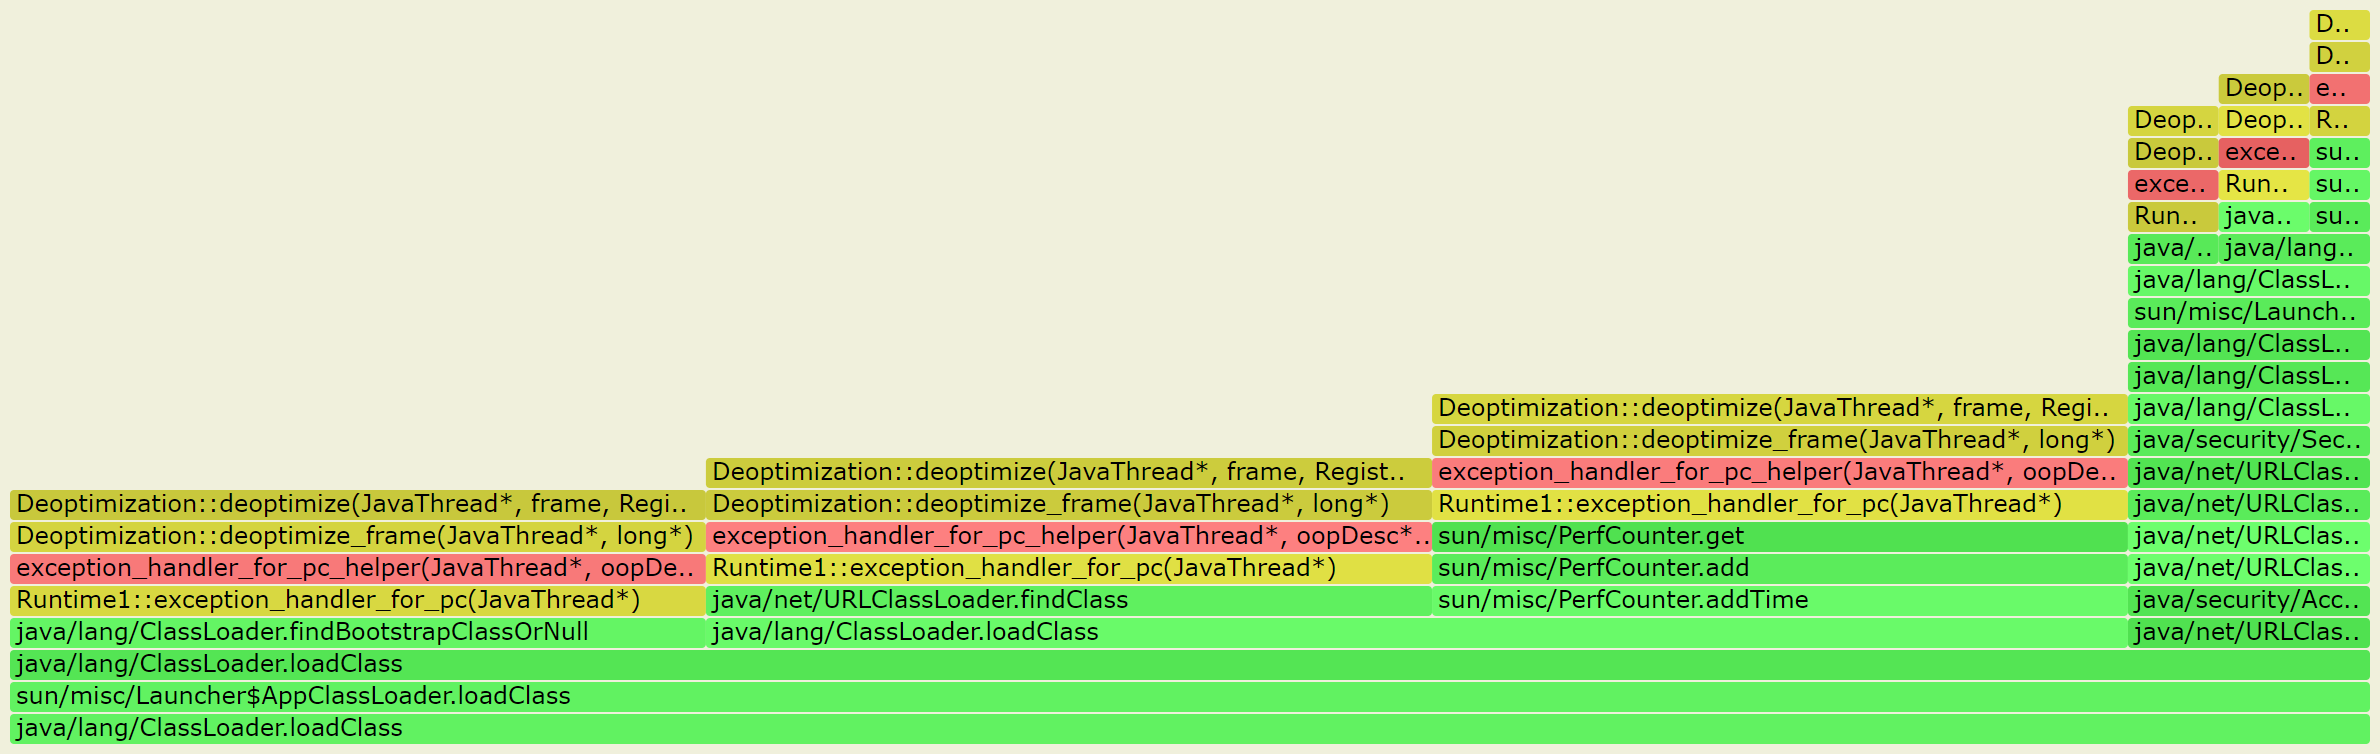
大多数去优化来自于exception_handler_for_pc_helper。如果我们看看这个函数的源代码,我们会看到一个有趣的评论:
  if (JvmtiExport::can_post_on_exceptions()) {
    // To ensure correct notification of exception catches and throws
    // we have to deoptimize here.

    <...>

    // We don't really want to deoptimize the nmethod itself since we
    // can actually continue in the exception handler ourselves but I
    // don't see an easy way to have the desired effect.
    Deoptimization::deoptimize_frame(thread, caller_frame.id());
这意味着-当JVM异常通知打开时,每次编译代码中出现异常时,HotSpot都会强制进行去优化!如果异常频繁,这肯定会影响性能。
如何分析没有JVM TI开销的异常?
此时,您可能已经猜到了答案--再次使用异步分析器:)除了CPU和本机功能分析之外,它还可以拦截任何Java方法调用。
要查找创建异常和错误的所有位置,我们只需拦截Throwable构造函数。为此,请将java.lang.Throwable.<init>指定为异步分析器事件。这一次,可以方便地生成一个反向调用树(添加reversed,file=tree.html选项),这样就可以根据类型和建筑站点对可移植对象进行分组。
java -agentpath:/path/to/libasyncProfiler.so=start,event=java.lang.Throwable.\<init\>,reverse,file=tree.html ...这将生成一个交互式HTML树,在该树中,您将找到所有有计数器和完整堆栈跟踪的异常:
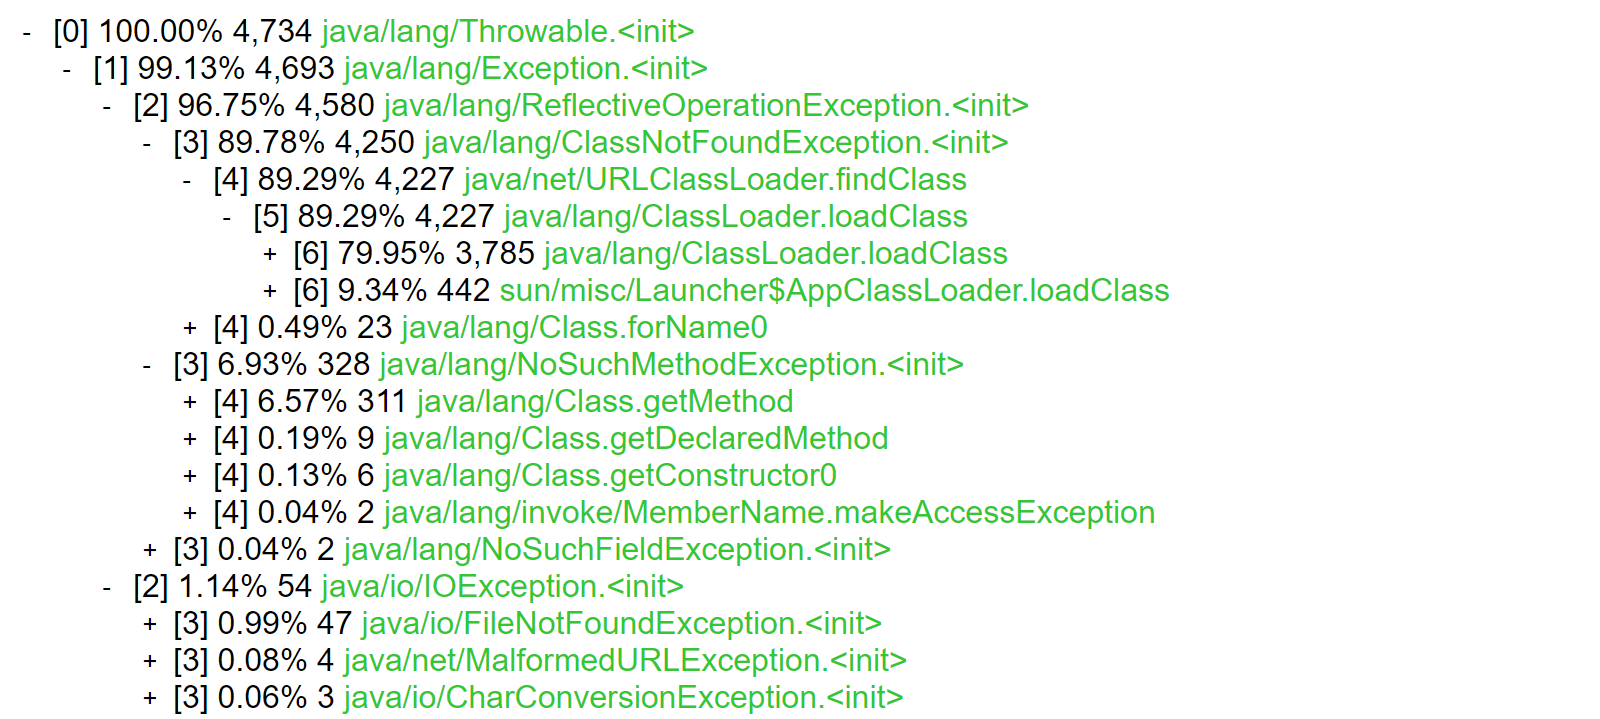
唉哟!一个简单的Spring应用程序会引发4700个异常:其中大多数是ClassNotFoundException (90%)和NoSuchMethodException (7%)。
重要的是,异步分析器使用字节码工具进行方法跟踪,因此它不会受到JVM TI异常回调的性能问题的影响。
奖金
在第一次分析代理时,除了去优化问题之外,我还发现了相当数量的堆栈跟踪,其中CPU时间用于ExceptionCallback调用GetMethodDeclaringClass和GetMethodName。
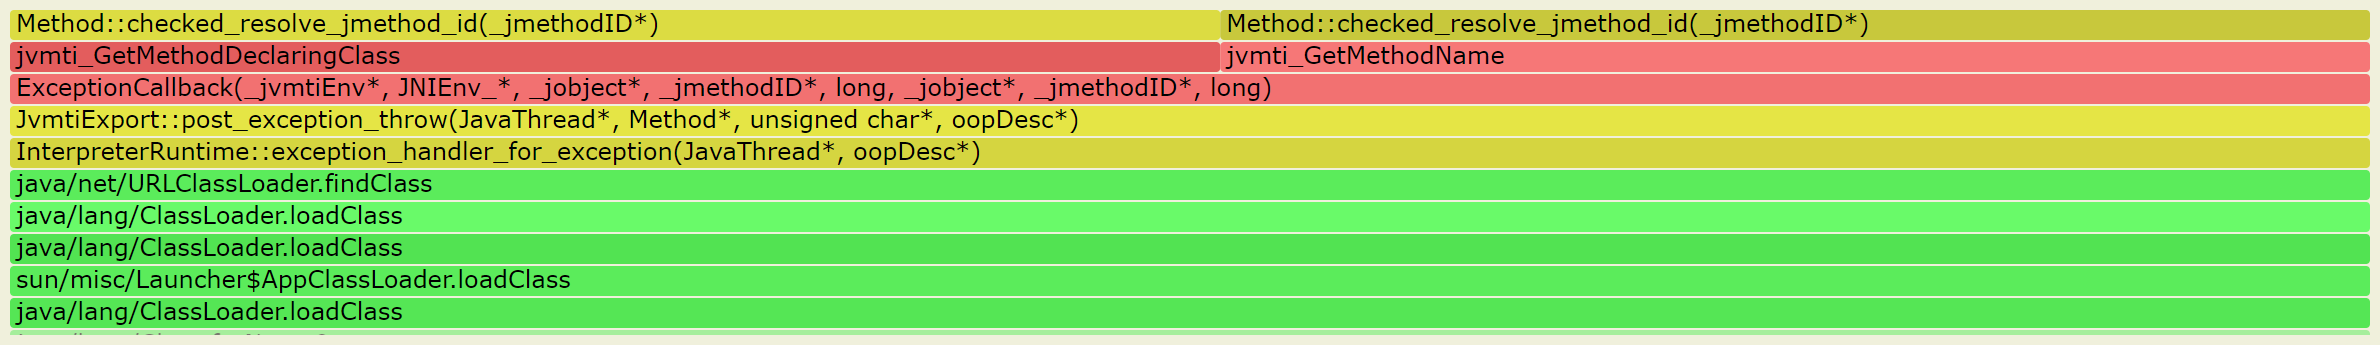
这实际上是JDK 8中的一个性能缺陷,我在3年前就已经报道过了:JDK-8185348。最后在JDK 8u 281中对其进行了修正。然而,在JDK 9+中没有这样的问题。
简而言之,由于所有JVM TI方法函数都比较慢,所以最好缓存这些函数的结果,这样代理就不会多次为同一方法调用JVM TI函数。
https://stackoverflow.com/questions/64468923
复制相似问题
腾讯云开发者

Copyright © 2013 - 2026 Tencent Cloud. All Rights Reserved. 腾讯云 版权所有
深圳市腾讯计算机系统有限公司 ICP备案/许可证号:粤B2-20090059 ![]() 粤公网安备44030502008569号
粤公网安备44030502008569号
腾讯云计算(北京)有限责任公司 京ICP证150476号 | 京ICP备11018762号