
在R中更改条形图颜色和图例标题
在R中更改条形图颜色和图例标题
提问于 2020-10-24 18:05:17
所以我把三个不同的情节映射到一个地块上。让传奇标题是正确的需要一些时间,但现在我似乎不能改变的颜色酒吧的情节,而不混乱的标题。我希望酒吧的颜色更简单(灰度或黑色/红色),我想改变传奇标题。我通常可以改变一件事,但我最终失去了其他功能,是有益的,谢谢!
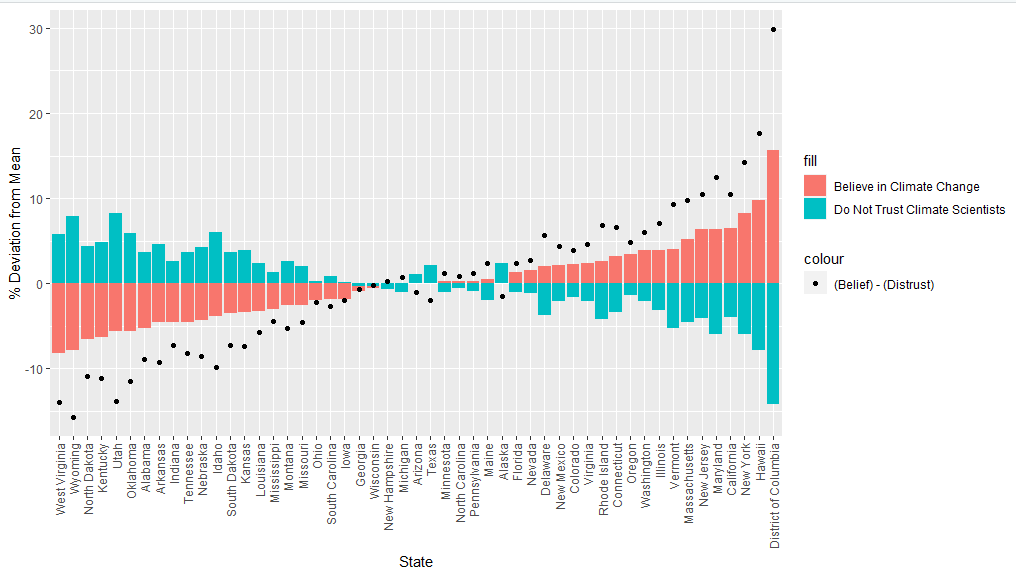
ggplot(data = media_impact_by_state) +
  #plot the deviation from state mean for believe CC is
  geom_bar(aes(x = reorder(GeoName,happening - mean(happening)),
               y = happening - mean(happening),
               fill = "Believe in Climate Change"),
               stat = 'identity') +
  scale_color_manual(values = "black",label = "Boo") +
  #plot the deviation from the mean for distrust of climate scientists
  geom_bar(aes(x= GeoName,
               y= trustclimsciSSTOppose - mean(trustclimsciSSTOppose),
               fill = "Do Not Trust Climate Scientists"),
           stat = 'identity') +
  #plot the difference in belief and and trust
  geom_point(aes(x = GeoName,
                 y = (happening - mean(happening))-
                    (trustclimsciSSTOppose - mean(trustclimsciSSTOppose)),
                    color = "(Belief) - (Distrust)")) +
  scale_color_manual(values = "black") +
  labs(x = "State",
       y = "% Deviation from Mean") +
  theme(axis.text.x = element_text(angle = 90, vjust = 0.5, hjust=1))
回答 1
Stack Overflow用户
回答已采纳
发布于 2020-10-24 18:26:24
由于您没有提供任何数据,所以我无法检查我的代码,但是这应该可以完成您正在寻找的任务:
- 在我看来,在geom中设置标签不是个好主意。只需使用简单的占位符,如"fill1“或.
使用scale_fill_manual.内部的命名向量来分配正确的颜色和标签的
    ggplot(data = media_impact_by_state) +
      geom_bar(aes(x = reorder(GeoName,happening - mean(happening)),
                   y = happening - mean(happening), fill = "fill1"),
               stat = 'identity') +
      scale_color_manual(values = "black", label = "Boo") +
      geom_bar(aes(x= GeoName, y= trustclimsciSSTOppose - mean(trustclimsciSSTOppose), fill = "fill2"),
               stat = 'identity') +
      geom_point(aes(x = GeoName, y = (happening - mean(happening)) -
                       (trustclimsciSSTOppose - mean(trustclimsciSSTOppose)),
                     color = "(Belief) - (Distrust)")) +
      scale_color_manual(values = "black") +
      scale_fill_manual(values = c(fill1 = "red", fill2 = "black"),
                        labels = c(fill1 = "Believe in Climate Change", fill2 = "Do Not Trust Climate Scientists")) +
      labs(x = "State",
           y = "% Deviation from Mean") +
theme(axis.text.x = element_text(angle = 90, vjust = 0.5, hjust=1)) 页面原文内容由Stack Overflow提供。腾讯云小微IT领域专用引擎提供翻译支持
原文链接:
https://stackoverflow.com/questions/64516512
复制相关文章
相似问题
腾讯云开发者

Copyright © 2013 - 2026 Tencent Cloud. All Rights Reserved. 腾讯云 版权所有
深圳市腾讯计算机系统有限公司 ICP备案/许可证号:粤B2-20090059 ![]() 粤公网安备44030502008569号
粤公网安备44030502008569号
腾讯云计算(北京)有限责任公司 京ICP证150476号 | 京ICP备11018762号