
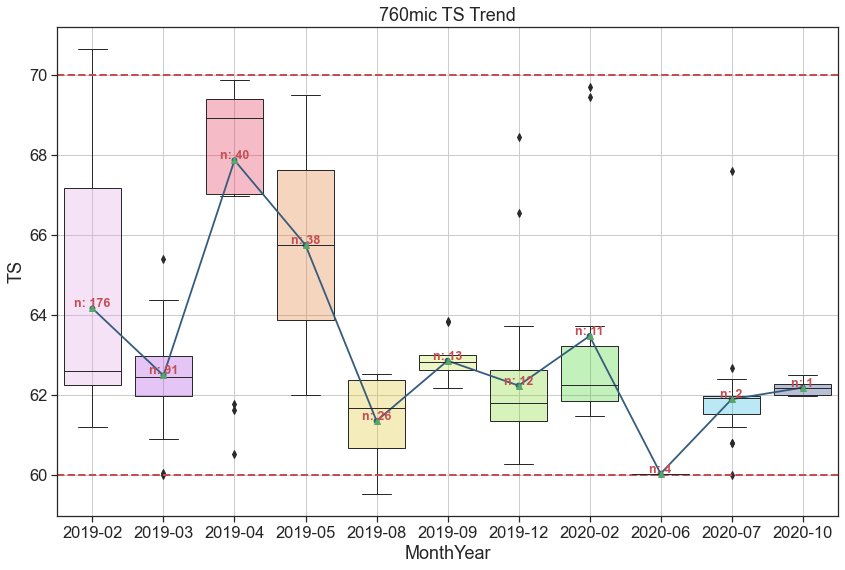
方框图中显示错误的记录数
方框图中显示错误的记录数
提问于 2020-11-06 10:17:36
我对Python非常陌生。我需要记录的数量显示在每个方框图,因为它将提供每个月的密度,以便作出决定。
在下面的框图中,每个月的记录数与原始数据不匹配。有人能告诉我哪里错了吗?
order = np.sort(df760['MonthYear'].unique())
ax = sns.boxplot(x='MonthYear', y='TS', order=order, dodge=True,
                 showfliers=True, showmeans=True,linewidth =1,
                 data=df760,palette ='gist_ncar_r')
for patch in ax.artists:
     r, g, b, a = patch.get_facecolor()
     patch.set_facecolor((r, g, b, .3))

# Calculate number of obs per group & median to position labels
means = df760.groupby(['MonthYear'])['TS'].mean().values
nobs = df760['MonthYear'].value_counts().values
nobs = [str(x) for x in nobs.tolist()]
nobs = ["n: " + i for i in nobs]

# Add it to the plot
pos = range(len(nobs))
for tick,label in zip(pos,ax.get_xticklabels()):
    ax.text(pos[tick], means[tick] + 0.03, nobs[tick],
            horizontalalignment='center', size='x-small',
            color='r', weight='semibold')

ax = sns.pointplot(x='MonthYear', y='TS', order=order, data=df760,
                   ci=None, color='#355C7D')
plt.title("760mic TS Trend")
plt.axhline(y=60, color='r', linestyle='--',linewidth = 2)
plt.axhline(y=70, color='r', linestyle='--',linewidth = 2)
plt.grid(True)
fig_size = [14,9]
plt.rcParams["figure.figsize"] = fig_size
plt.show()
以下是我的数据示例(您可以看到10月份的数据超过1):
    MonthYear   TS
384 2020-07 61.22
385 2020-07 61.29
386 2020-07 61.56
387 2020-07 61.39
388 2020-07 62.25
389 2020-07 61.21
390 2020-07 61.84
391 2020-07 62.13
392 2020-07 61.93
393 2020-07 62.23
394 2020-07 60.00
395 2020-07 62.68
396 2020-07 67.60
397 2020-07 62.41
398 2020-07 62.00
399 2020-07 62.32
400 2020-07 61.54
401 2020-07 60.81
402 2020-07 60.80
403 2020-10 62.33
404 2020-10 62.01
405 2020-10 62.01
406 2020-10 62.01
407 2020-10 62.25
408 2020-10 62.42
409 2020-10 62.50
410 2020-10 61.98
411 2020-10 62.25
412 2020-10 62.17
413 2020-10 62.15
根据所提供的答案更改代码后出错:
---------------------------------------------------------------------------
AttributeError                            Traceback (most recent call last)
<ipython-input-9-ac362a622ff4> in <module>
      7 # Calculate number of nobs per group & median to position labels
      8 means = df760.groupby(['MonthYear'])['TS'].mean().values
----> 9 nobs = df760['MonthYear'].value_counts().reindex(means.index).values
     10 nobs = [str(x) for x in nobs.tolist()]
     11 nobs = ["n: " + i for i in nobs]

AttributeError: 'numpy.ndarray' object has no attribute 'index'回答 1
Stack Overflow用户
回答已采纳
发布于 2020-11-08 21:13:36
我认为问题的根源在于
means = df760.groupby(['MonthYear'])['TS'].mean().values
nobs = df760['MonthYear'].value_counts().valuesmeans和nobs不能保证顺序相同。实际上,几乎可以保证它们的顺序不一样。The documentation for value_counts说
结果对象将按降序排列,因此第一个元素是最常见的元素。
正如你在你的情节中所看到的,记录的数量从左到右从最高到最低。
解决方案是通过nobs ing强制means保持与reindex相同的顺序。
means = df760.groupby(['MonthYear'])['TS'].mean()
nobs = df760['MonthYear'].value_counts().reindex(means.index).values
means = means.values页面原文内容由Stack Overflow提供。腾讯云小微IT领域专用引擎提供翻译支持
原文链接:
https://stackoverflow.com/questions/64712693
复制相关文章
相似问题
腾讯云开发者

Copyright © 2013 - 2026 Tencent Cloud. All Rights Reserved. 腾讯云 版权所有
深圳市腾讯计算机系统有限公司 ICP备案/许可证号:粤B2-20090059 ![]() 粤公网安备44030502008569号
粤公网安备44030502008569号
腾讯云计算(北京)有限责任公司 京ICP证150476号 | 京ICP备11018762号