
根据上下文绘制的数据可视化图
根据上下文绘制的数据可视化图
提问于 2020-11-12 04:05:53
你能检查一下我的情节构思对上下文是否正确吗?
- 由连续变量描述的10个个体组成的系列/由10个类别的连续变量的频率分布描述的一系列200个个体:直方图
- 是由连续变量和一个范畴变量描述的300个个体,有5类:蜂群或蜂群
。
- 由一个数值离散变量描述的一系列200个个体,有5种模式:条形图
一个由连续变量描述的200个个体的系列和一个包含4个类别的范畴变量/一个由连续变量描述的200个个体和一个包含4个类别的分类变量的系列:方框plot(edited)
- 一个包含两个范畴变量和3个类别的列联表/一个数值离散变量的列联表和一个包含三个类别的范畴变量:叠加百分比条形图
回答 1
Stack Overflow用户
回答已采纳
发布于 2020-11-12 12:00:56
有很多很多方法来绘制你的数据。以下是一些有例子的建议:
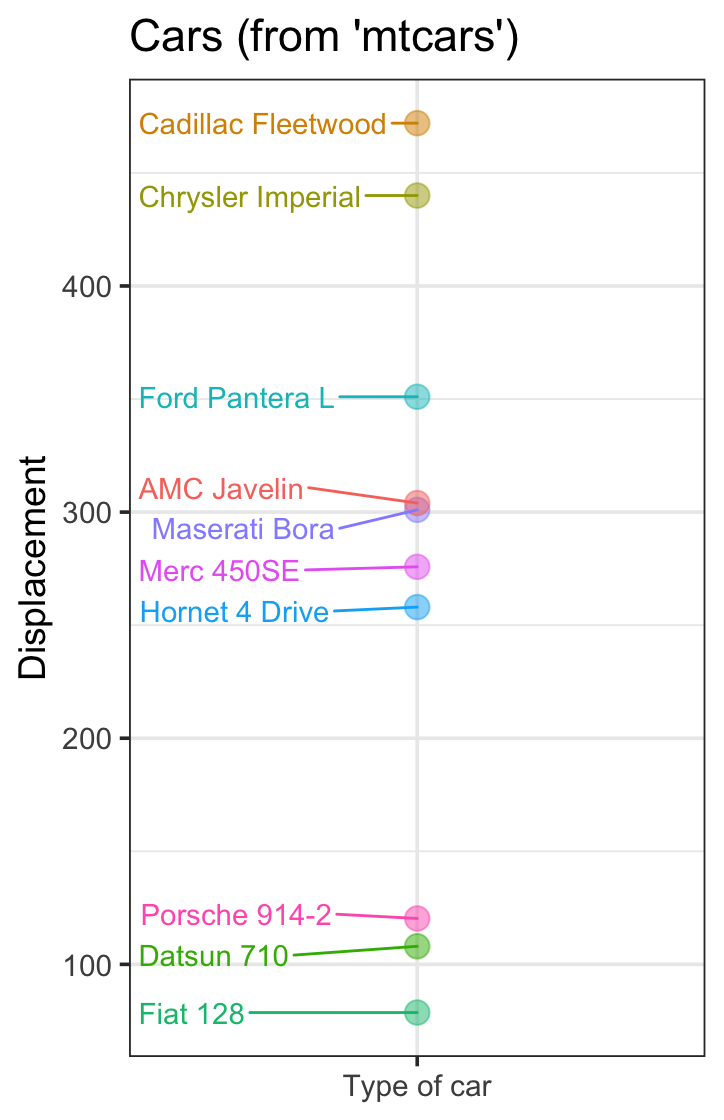
10个个体连续变量的系列:
library(tidyverse)
library(ggrepel)
data("mtcars")
mtcars %>%
  sample_n(size = 10) %>%
  select(disp) %>%
  ggplot(aes(y = disp,
             x = "Type of car",
             label = rownames(.),
             color = rownames(.))) +
  geom_point(size = 4, alpha = 0.5) +
  geom_text_repel(nudge_x = -.5) +
  ylab("Displacement") +
  ggtitle("Cars (from 'mtcars')") +
  theme_bw(base_size = 14) +
  theme(axis.title.x = element_blank(),
        legend.position = "none")
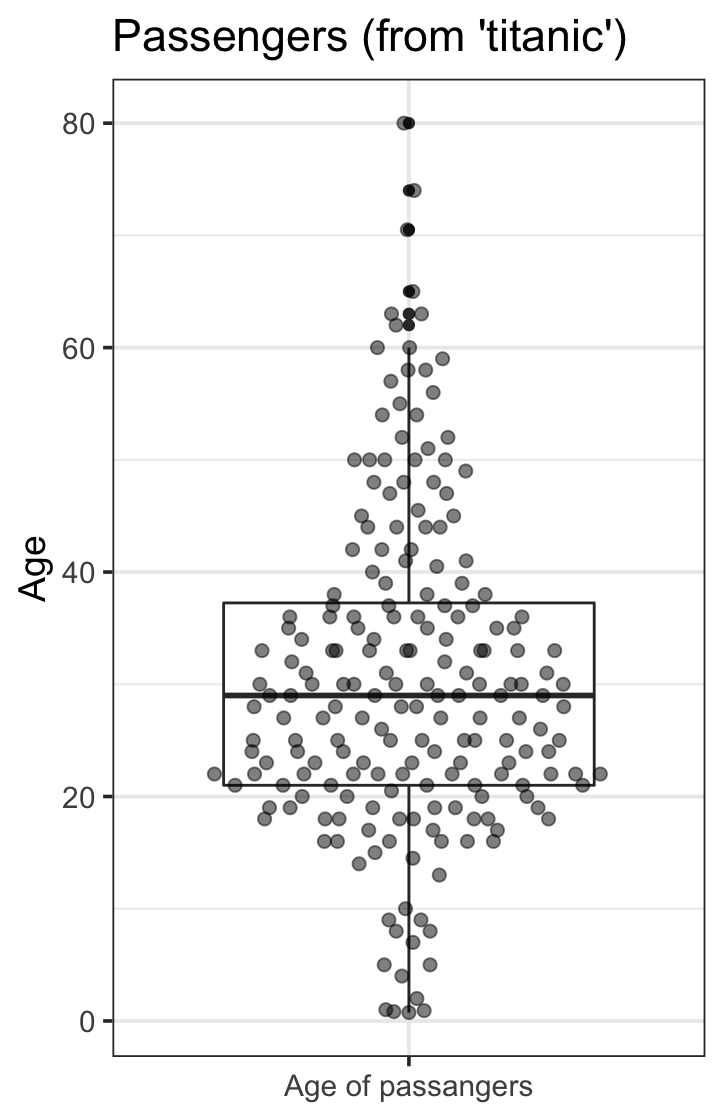
由一个连续变量描述的200个人的系列:
library(titanic)
library(ggbeeswarm)
data("Titanic")
titanic_train %>%
  na.omit() %>%
  sample_n(200) %>%
  select(Age) %>%
  ggplot(aes(y = Age,
             x = "Age of passangers")) +
  geom_boxplot() +
  geom_quasirandom(groupOnX = TRUE,
                   size = 2, alpha = 0.5) +
  ggtitle("Passengers (from 'titanic')") +
  theme_bw(base_size = 14) +
  theme(axis.title.x = element_blank(),
        legend.position = "none")
有10个类别的范畴变量的频率分布:
data("cars")
cars %>%
  na.omit() %>%
  mutate(Average_speed = factor(speed)) %>%
  count(Average_speed, name = "frequency") %>%
  sample_n(10) %>%
  ggplot(aes(x = Average_speed,
             y = frequency)) +
  geom_col() +
  ggtitle("Average Speed (from 'cars')") +
  theme_bw(base_size = 14) +
  theme(legend.position = "none")
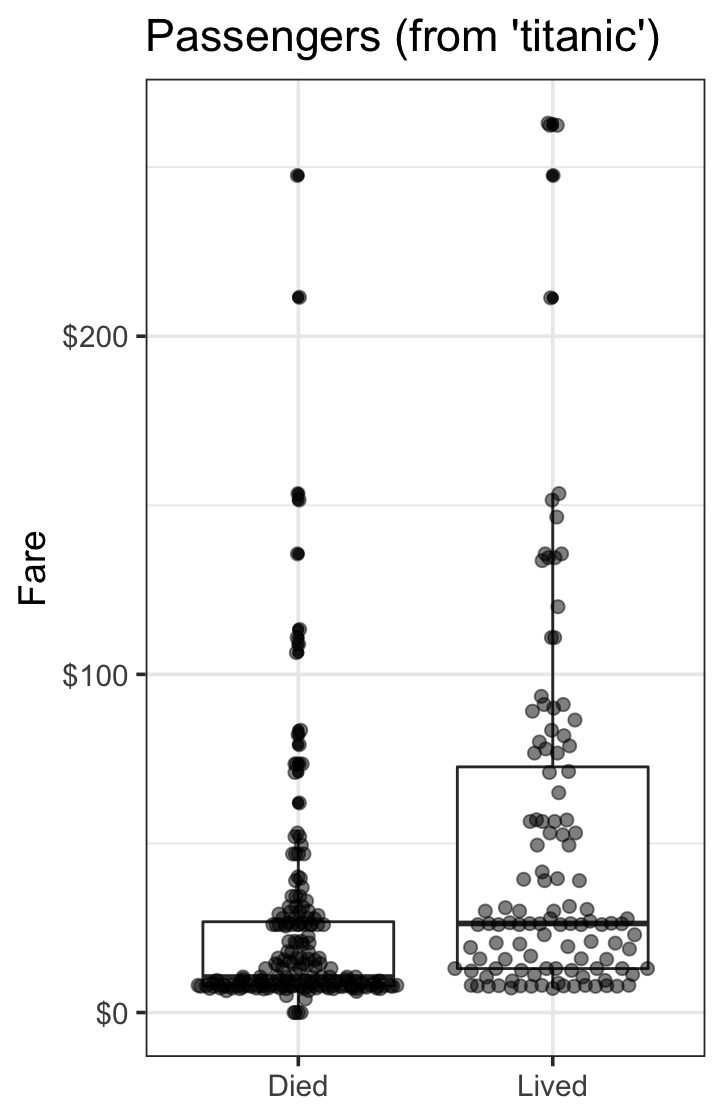
由连续变量和范畴变量描述的300人组成的系列,分为5类:
data("Titanic")
titanic_train %>%
  na.omit() %>%
  sample_n(300) %>%
  select(Fare, Survived) %>%
  mutate(Survived = factor(Survived,
                           labels = c("Died",
                                      "Lived"))) %>%
  ggplot(aes(y = Fare,
             x = Survived,
             group = Survived)) +
  geom_boxplot() +
  geom_quasirandom(groupOnX = TRUE,
                   size = 2, alpha = 0.5) +
  ggtitle("Passengers (from 'titanic')") +
  scale_y_continuous(labels = scales::dollar_format()) +
  theme_bw(base_size = 14) +
  theme(axis.title.x = element_blank(),
        legend.position = "none")
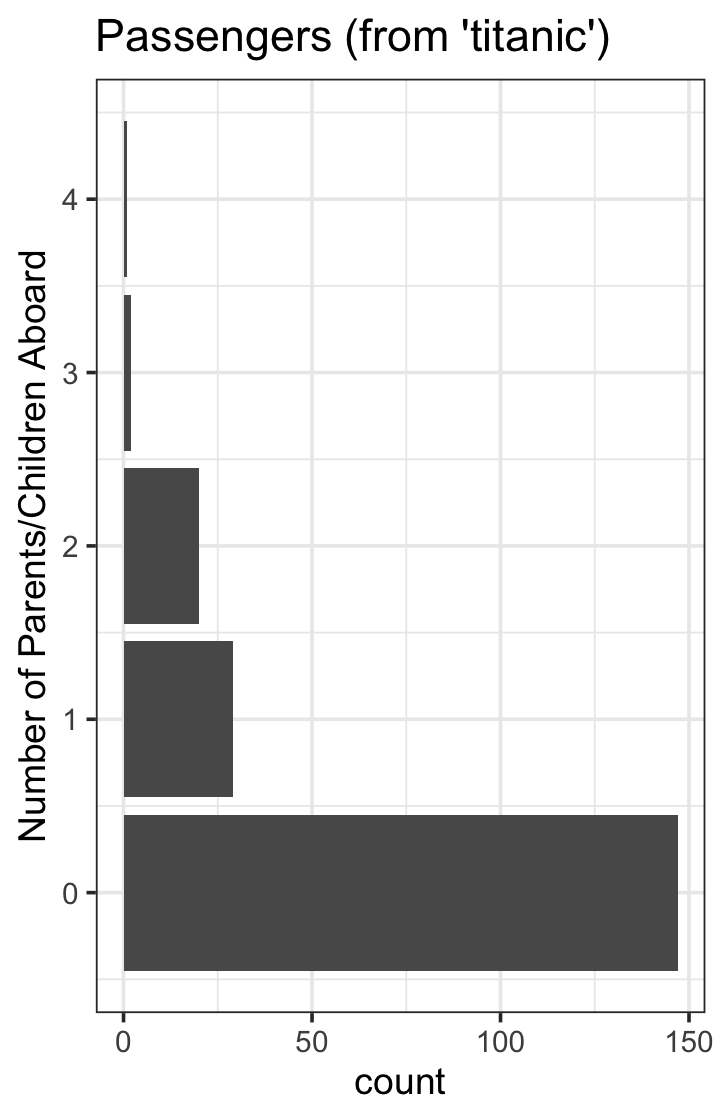
数字离散变量描述的200人系列,有5种模式:
data("Titanic")
titanic_train %>%
  na.omit() %>%
  sample_n(200) %>%
  select(Parch) %>%
  filter(Parch < 5) %>%
  ggplot(aes(y = Parch)) +
  geom_bar() +
  ggtitle("Passengers (from 'titanic')") +
  ylab("Number of Parents/Children Aboard") +
  theme_bw(base_size = 14) +
  theme(legend.position = "none")
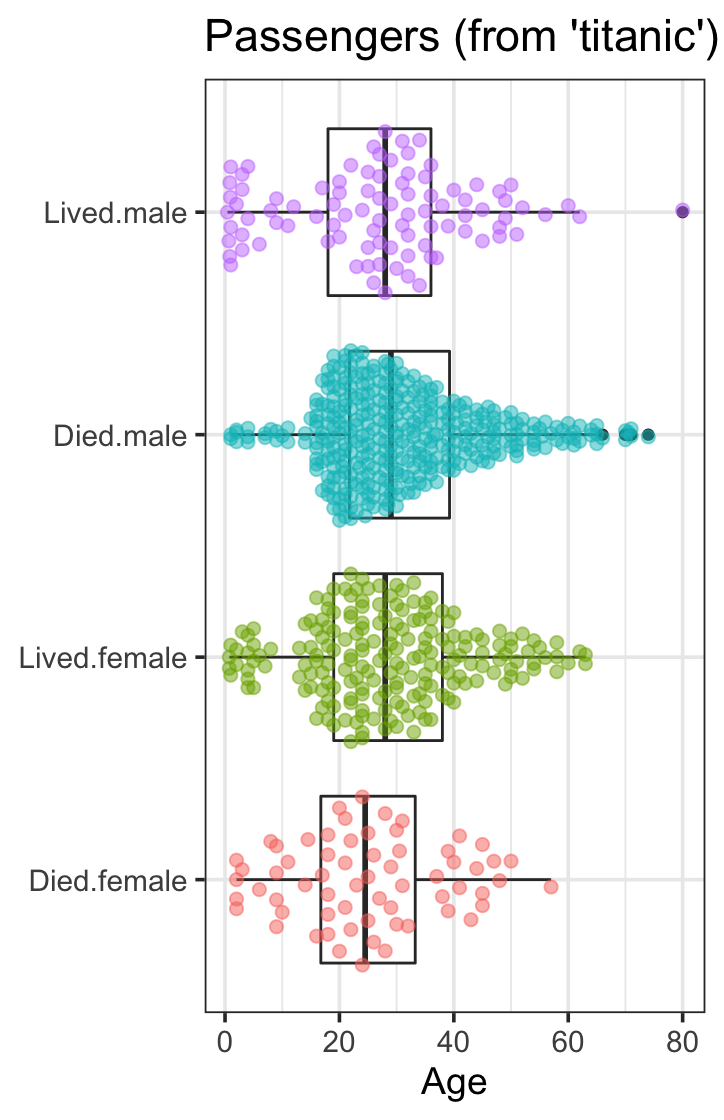
由连续变量和范畴变量描述的200人组成的系列,分为4类:
titanic_train %>%
  na.omit() %>%
  mutate(Survived = factor(Survived,
                           labels = c("Died",
                                      "Lived"))) %>%
  mutate(Interaction = interaction(Survived, Sex)) %>%
  select(Interaction, Age) %>%
  ggplot(aes(y = Age,
             x = Interaction)) +
  geom_boxplot() +
  geom_quasirandom(aes(color = Interaction),
                   size = 2, alpha = 0.5) +
  coord_flip() +
  ggtitle("Passengers (from 'titanic')") +
  theme_bw(base_size = 14) +
  theme(axis.title.y = element_blank(),
        legend.position = "none")
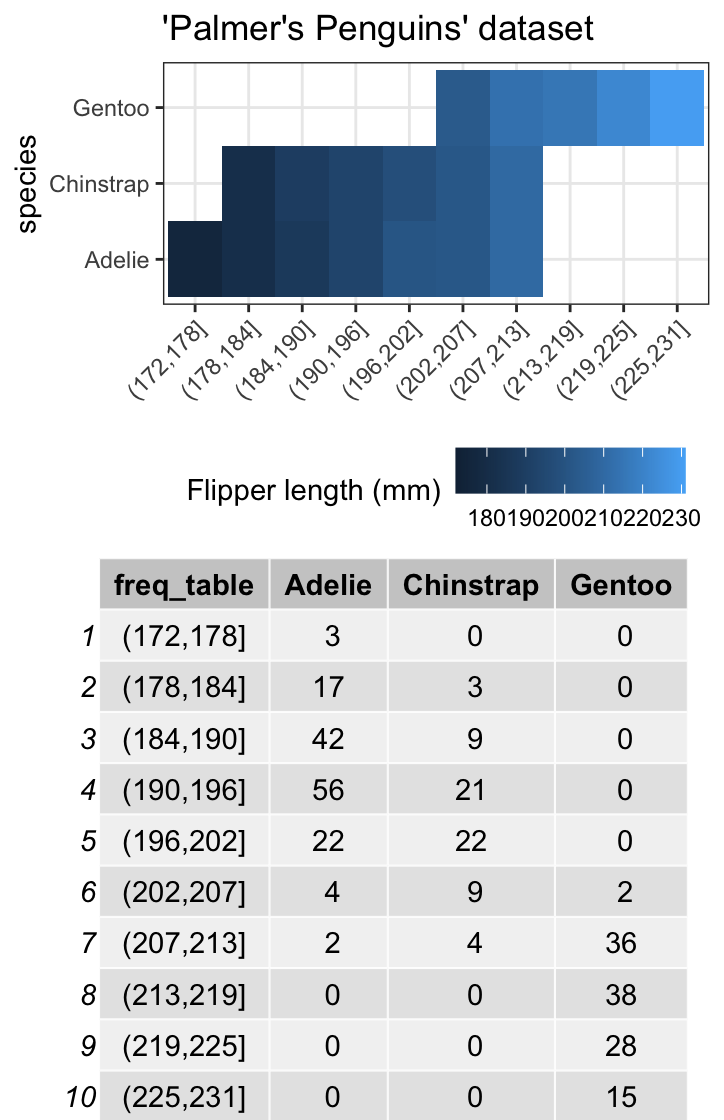
一个包含两个范畴变量的应急表,包括10个类别和3个类别:
library(janitor)
library(ggpubr)
library(palmerpenguins)
part_1 <- penguins %>%
  na.omit() %>%
  select(species, flipper_length_mm) %>%
  mutate(freq_table = cut(flipper_length_mm, breaks = 10)) %>%
  ggplot(aes(y = species, x = freq_table, fill = flipper_length_mm)) +
  geom_tile() +
  ggtitle("'Palmer's Penguins' dataset") +
  scale_fill_continuous(name = "Flipper length (mm)") +
  theme_bw() +
  theme(legend.position = "bottom",
        axis.text.x = element_text(angle = 45, hjust = 1),
        axis.title.x = element_blank())

part_2 <- penguins %>%
  na.omit() %>%
  select(species, flipper_length_mm) %>%
  mutate(freq_table = cut(flipper_length_mm, breaks = 10)) %>%
  tabyl(freq_table, species) %>%
  ggtexttable()

ggarrange(part_1, part_2, ncol = 1)
页面原文内容由Stack Overflow提供。腾讯云小微IT领域专用引擎提供翻译支持
原文链接:
https://stackoverflow.com/questions/64797776
复制相关文章
相似问题
腾讯云开发者

Copyright © 2013 - 2026 Tencent Cloud. All Rights Reserved. 腾讯云 版权所有
深圳市腾讯计算机系统有限公司 ICP备案/许可证号:粤B2-20090059 ![]() 粤公网安备44030502008569号
粤公网安备44030502008569号
腾讯云计算(北京)有限责任公司 京ICP证150476号 | 京ICP备11018762号