
多个netcdf与xarray或satpy的空间合并/组合
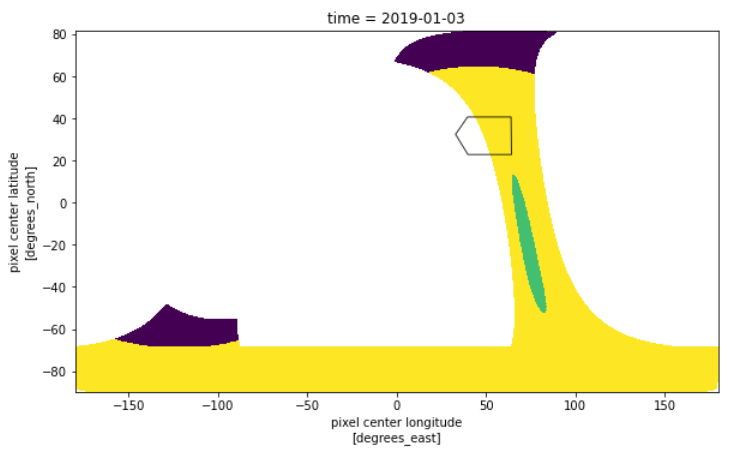
我有两个netcdf格式的空间数据集。它们具有相同的时间、尺寸、坐标和数据变量。但它们适用于不同的空间坐标。在下面,我尝试用多边形显示我的两个数据集:
import glob
import xarray as xr
import geopandas as gpd
import pandas as pd
import matplotlib.pyplot as plt
%matplotlib inline

file1 = '20190109T071048.nc'
file2 = '20190109T085117.nc'

ds1 = xr.open_dataset(file1, group='PRODUCT')
ds2 = xr.open_dataset(file2, group='PRODUCT')

PATH_TO_GPK = 'Study_Area.gpkg'
SA = gpd.read_file(PATH_TO_GPK, layer='Study_Area')
第一个数据集图:
plt.figure(figsize=(12,8))
ax = plt.axes()
ds1.qa_value.isel(time = 0).plot(ax = ax, x='longitude', y='latitude')
SA.plot(ax = ax, alpha = 0.8, facecolor = 'none')
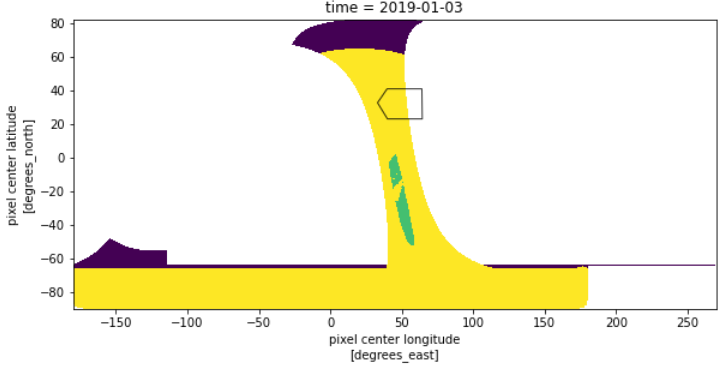
第二个数据集图:
plt.figure(figsize=(12,8))
ax = plt.axes()
ds2.qa_value.isel(time = 0).plot(ax = ax, x='longitude', y='latitude')
SA.plot(ax = ax, alpha = 0.8, facecolor = 'none')
我想将这两个netcdf文件与xarray合并。
combined = xr.merge([ds1, ds2], compat='no_conflicts')错误:
MergeError: conflicting values for variable 'latitude' on objects to be combined. You can skip this check by specifying compat='override'.试过:
combined = xr.merge([ds1, ds2], compat='override')但combined图与第一幅样地相同。然后试着:
combined = xr.combine_by_coords([ds1,ds2], compat='no_conflicts')错误:
Could not find any dimension coordinates to use to order the datasets for concatenation然后试着:
combined = xr.combine_nested([ds1,ds2], concat_dim=["time"])combined的小区又与第一个小区相同。根据ThomasNicolas的建议,我使用了以下代码:
ds = xr.open_mfdataset([file1, file2], combine='nested')但是它返回这个错误:
AttributeError: 'Dataset' object has no attribute 'qa_value'因此,没有任何数据:
第一个数据集的打印(例如)显示:
print (ds1)

<xarray.Dataset>
Dimensions:                          (corner: 4, ground_pixel: 450, scanline: 3245, time: 1)
Coordinates:
  * scanline                         (scanline) float64 0.0 1.0 ... 3.244e+03
  * ground_pixel                     (ground_pixel) float64 0.0 1.0 ... 449.0
  * time                             (time) datetime64[ns] 2019-01-03
  * corner                           (corner) float64 0.0 1.0 2.0 3.0
    latitude                         (time, scanline, ground_pixel) float32 ...
    longitude                        (time, scanline, ground_pixel) float32 ...
Data variables:
    delta_time                       (time, scanline) timedelta64[ns] 08:07:0...
    time_utc                         (time, scanline) object '2019-01-03T08:0...
    qa_value                         (time, scanline, ground_pixel) float32 ...
是否有任何合并或合并这些文件的建议?
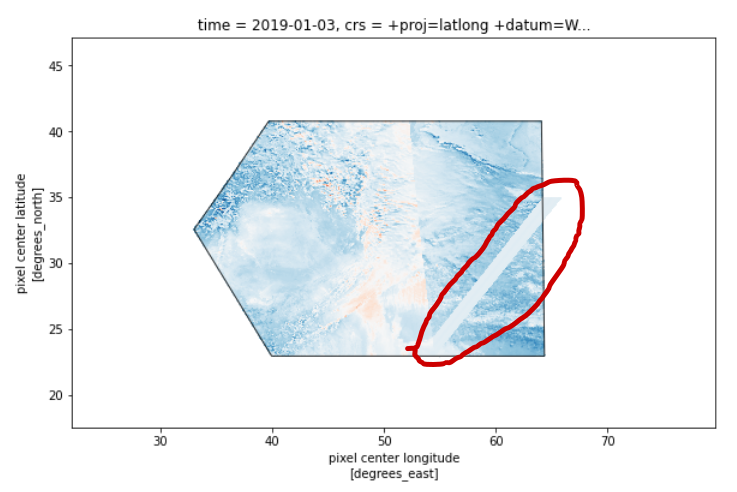
已更新
基于@dl.meteo的建议,我使用了satpy库来解决我的问题,它似乎可以合并两个netcdf文件,但并不完全,您可以在联接图像中看到一个不正确的部分(红色边界)。satpy能正确地做到这一点吗?
# Read NetCDF files
from satpy import Scene
import glob

filenames = glob.glob('myfiles*.nc')
scn = Scene(filenames=filenames, reader='tropomi_l2')
scn.load(['qq'])

mask = SA_mask_poly.mask(d, lat_name='latitude', lon_name='longitude')
out_sel = d.compute().where(mask == 0, drop=True)

plt.figure(figsize=(12,8))
ax = plt.axes()
out_sel.plot(ax = ax, x='longitude', y='latitude')
SA.plot(ax = ax, alpha = 0.8, facecolor = 'none', lw = 1)
回答 1
Stack Overflow用户
发布于 2022-06-09 16:08:31
我刚才遇到了这个问题。xarray不能用不同的坐标组合值。由于您的两次传球都有自己独特的坐标,所以不能直接将它们组合起来。
其中一种解决方案是使用pyresample模块将两个颗粒从它们自己的坐标重采样到一个公共网格上。将每个文件作为单独的Scene打开,然后应用scn.resample()方法。这将把两者放在同一个网格上。从那里你可以把它们结合起来。
另一个解决方案可能是为这个用例设计的实验性MultiScene对象。根据文档
Satpy中的场景对象是指在特定的时间或时间范围内的单个地理区域。这意味着它们不适合处理极地轨道卫星数据的多个轨道、地球静止卫星数据的多个时间步骤或其他特殊数据情况。为了处理这些情况,Satpy提供了MultiScene类。
您当前的解决方案之所以有人工制品,是因为您的Scene对象有两个独立的轨道,作为一个数组粘在一起。我认为,它们坐标的不连续性将导致四边形图中的拉伸/撕裂伪像和进一步处理,如卷积滤波,可能会返回意想不到的结果,因为它期望阵列中的相邻值在最终图像中是物理相邻的,而不是在另一个轨道上。
https://stackoverflow.com/questions/64793812
复制相似问题
腾讯云开发者

Copyright © 2013 - 2026 Tencent Cloud. All Rights Reserved. 腾讯云 版权所有
深圳市腾讯计算机系统有限公司 ICP备案/许可证号:粤B2-20090059 ![]() 粤公网安备44030502008569号
粤公网安备44030502008569号
腾讯云计算(北京)有限责任公司 京ICP证150476号 | 京ICP备11018762号