
可挠性数据合并
我想从这里合并(cbind或类似的)许多flextable对象:
to此文:
设立:
library(tidyverse)
library(flextable)
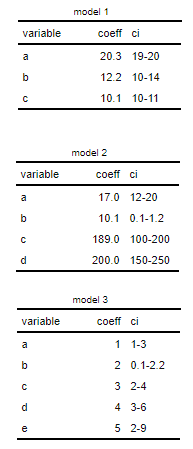
model1 <- data.frame("variable" = c(letters[1:3]),
"coeff" = c(20.3, 12.2, 10.1),
"ci" = c("19-20", "10-14", "10-11"))
model2 <- data.frame("variable" = c(letters[1:4]),
"coeff" = c(17, 10.1, 189, 200),
"ci" = c("12-20", "0.1-1.2", "100-200", "150-250"))
model3 <- data.frame("variable" = c(letters[1:5]),
"coeff" = c(1:5),
"ci" = c("1-3", "0.1-2.2", "2-4", "3-6", "2-9"))
t1 <- flextable(model1) %>%
add_header_row(values = c("", "model 1", "model 1"), top = T) %>% merge_at(i = 1:1, j = 2:3, part = "header")
t2 <- flextable(model2) %>%
add_header_row(values = c("", "model 2", "model 2"), top = T) %>% merge_at(i = 1:1, j = 2:3, part = "header")
t3 <- flextable(model3) %>%
add_header_row(values = c("", "model 3", "model 3"), top = T) %>% merge_at(i = 1:1, j = 2:3, part = "header")我不知道如何有效地合并这些数据集,我可以使数据集具有相同的大小,以便至少可以使用cbind,但这意味着删除和重新排序具有相同名称的列会很麻烦:
model1[nrow(model1) + (nrow(model3) - nrow(model1)), ] <- NA
model2[nrow(model2) + (nrow(model3) - nrow(model2)), ] <- NA
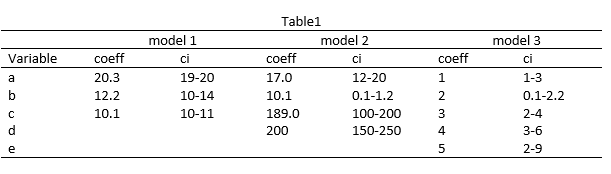
df_bind <- cbind(model1, model2, model3)
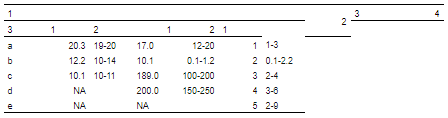
df_bind
# variable coeff ci variable coeff ci variable coeff ci
# 1 a 20.3 19-20 a 17.0 12-20 a 1 1-3
# 2 b 12.2 10-14 b 10.1 0.1-1.2 b 2 0.1-2.2
# 3 c 10.1 10-11 c 189.0 100-200 c 3 2-4
# 4 <NA> NA <NA> d 200.0 150-250 d 4 3-6
# 5 <NA> NA <NA> <NA> NA <NA> e 5 2-9然后我想使用flextable命令:
flextable(df_bind)
#Error in flextable(df_bind) : duplicated col_keys
这是行不通的,因为他们有相同的列名。
我唯一能想到的方法就是重命名每一个dataframe列(例如重命名为variable1、variable2、variable3等)。然后合并,然后使用add_header_row重命名为原始名称,但是这是非常低效率的。
有更简单的解决办法吗?
谢谢
编辑
我似乎无法复制“本解决方案”。当我跑步时:
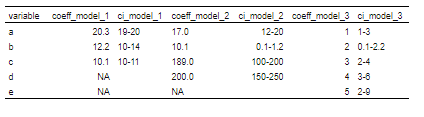
bind_rows(list(model_1 = model1, model_2 = model2, model_3 = model3), .id = 'model') %>%
  pivot_wider(id_cols = variable, names_from = model, values_from = c(coeff, ci)) %>%
  select(variable, coeff_model_1, ci_model_1,
         coeff_model_2, ci_model_2, coeff_model_3, ci_model_3) %>%
  flextable(col_keys = my_header$col_keys)
到目前为止,我得到了以下看起来还不错的信息:
然后,当我添加以下两行时:
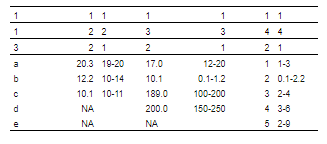
bind_rows(list(model_1 = model1, model_2 = model2, model_3 = model3), .id = 'model') %>%
  pivot_wider(id_cols = variable, names_from = model, values_from = c(coeff, ci)) %>%
  select(variable, coeff_model_1, ci_model_1,
         coeff_model_2, ci_model_2, coeff_model_3, ci_model_3) %>%
  flextable(col_keys = my_header$col_keys) %>%
  set_header_df(mapping = my_header, key = "col_keys") %>%
  theme_booktabs()
然后
bind_rows(list(model_1 = model1, model_2 = model2, model_3 = model3), .id = 'model') %>%
  pivot_wider(id_cols = variable, names_from = model, values_from = c(coeff, ci)) %>%
  select(variable, coeff_model_1, ci_model_1,
         coeff_model_2, ci_model_2, coeff_model_3, ci_model_3) %>%
  flextable(col_keys = my_header$col_keys) %>%
  set_header_df(mapping = my_header, key = "col_keys") %>%
  theme_booktabs() %>%
  merge_v(part = "header") %>%
  merge_h(part = "header")
最后
bind_rows(list(model_1 = model1, model_2 = model2, model_3 = model3), .id = 'model') %>%
  pivot_wider(id_cols = variable, names_from = model, values_from = c(coeff, ci)) %>%
  select(variable, coeff_model_1, ci_model_1,
         coeff_model_2, ci_model_2, coeff_model_3, ci_model_3) %>%
  flextable(col_keys = my_header$col_keys) %>%
  set_header_df(mapping = my_header, key = "col_keys") %>%
  theme_booktabs() %>%
  merge_v(part = "header") %>%
  merge_h(part = "header") %>%
  align(align = "center", part = "all") %>%
  colformat_num(na_str = "")
R version 3.6.3 (2020-02-29)
Platform: x86_64-w64-mingw32/x64 (64-bit)
Running under: Windows 10 x64 (build 18363)

Matrix products: default

attached base packages:
[1] stats     graphics  grDevices utils     datasets  methods   base

other attached packages:
 [1] flextable_0.5.11 forcats_0.5.0    stringr_1.4.0    dplyr_1.0.2      purrr_0.3.4      readr_1.3.1      tidyr_1.1.2      tibble_3.0.3
 [9] ggplot2_3.3.2    tidyverse_1.3.0

loaded via a namespace (and not attached):
 [1] Rcpp_1.0.3        lubridate_1.7.9   lattice_0.20-38   assertthat_0.2.1  digest_0.6.25     utf8_1.1.4        R6_2.4.1          cellranger_1.1.0
 [9] backports_1.1.5   reprex_0.3.0      evaluate_0.14     httr_1.4.1        pillar_1.4.3      gdtools_0.2.1     rlang_0.4.8       readxl_1.3.1
[17] uuid_0.1-4        rstudioapi_0.11   data.table_1.12.8 rmarkdown_2.1     munsell_0.5.0     tinytex_0.20      broom_0.5.5       compiler_3.6.3
[25] modelr_0.1.6      xfun_0.12         pkgconfig_2.0.3   systemfonts_0.1.1 base64enc_0.1-3   htmltools_0.4.0   tidyselect_1.1.0  fansi_0.4.1
[33] crayon_1.3.4      dbplyr_1.4.2      withr_2.1.2       grid_3.6.3        nlme_3.1-144      jsonlite_1.6.1    gtable_0.3.0      lifecycle_0.2.0
[41] DBI_1.1.0         magrittr_1.5      scales_1.1.0      zip_2.1.1         cli_2.0.2         stringi_1.4.6     fs_1.3.2          xml2_1.2.5
[49] ellipsis_0.3.0    generics_0.0.2    vctrs_0.3.5       tools_3.6.3       glue_1.4.2        officer_0.3.14    hms_0.5.3         yaml_2.2.1
[57] colorspace_1.4-1 rvest_0.3.5 knitr_1.28 haven_2.2.0除了R的版本之外,我看不出sessionInfo有多大的不同,我还将officer更新为officer_0.3.14版本,但没有什么不同。看来set_header_df和colformat_num似乎工作不正常。
有什么想法吗?
回答 1
Stack Overflow用户
发布于 2020-11-18 20:27:08
也许这会有帮助。
使用列名以及标头标签设置标头。
使用bind_rows将所有模型放入长形式,并添加一列表示结果属于哪个模型。
使用pivot_wider将格式改为宽形式以供表示。之后,select将对您的列进行排序。
flextable set_header_df将根据列名(取自my_header键)提供标题标签。
library(tidyverse)
library(stringr)
library(flextable)
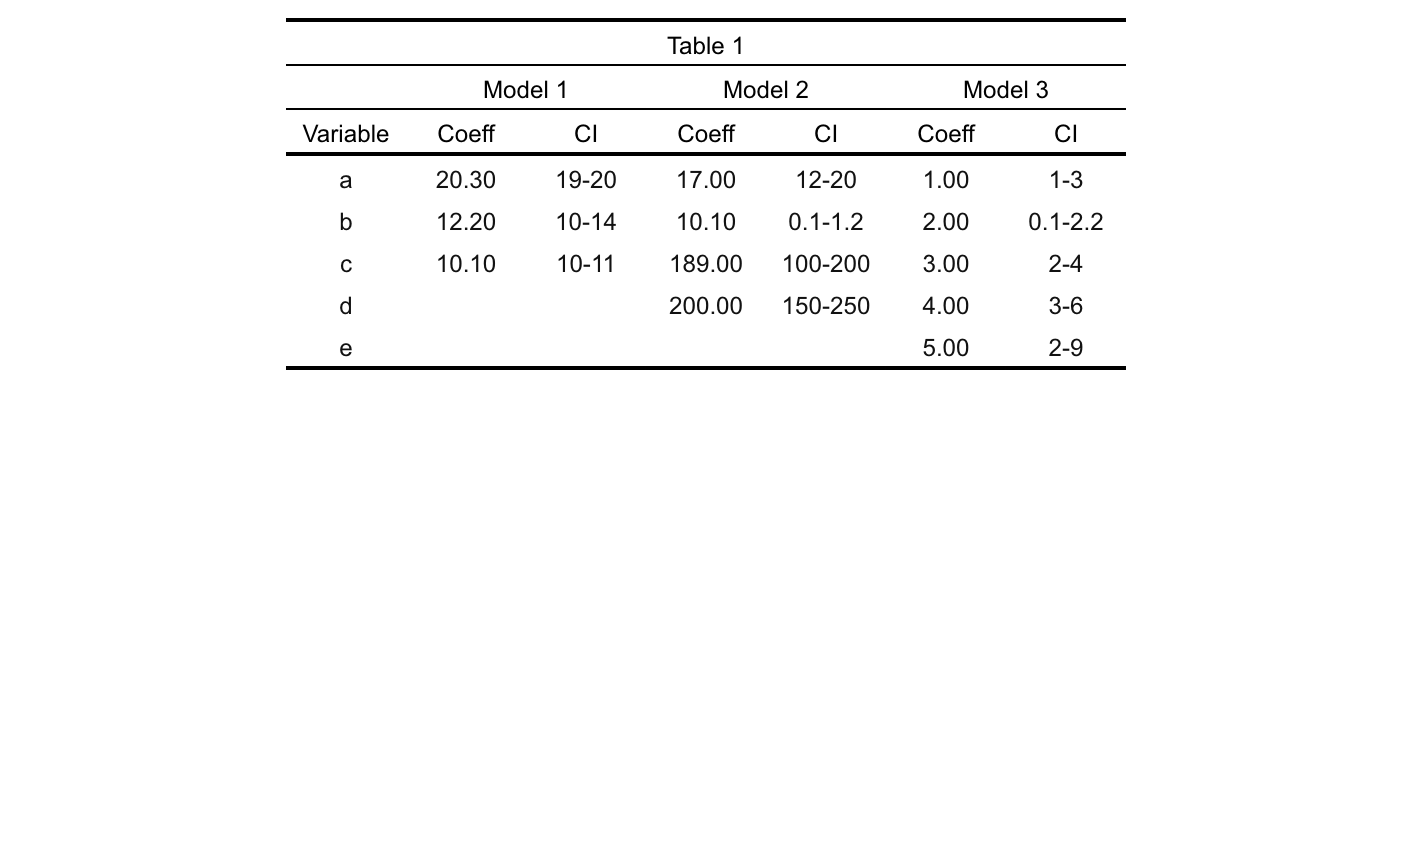
my_header <- data.frame(
col_keys = c("variable", "coeff_model_1", "ci_model_1",
"coeff_model_2", "ci_model_2", "coeff_model_3", "ci_model_3"),
line1 = "Table 1",
line2 = c("", rep("Model 1", 2), rep("Model 2", 2), rep("Model 3", 2)),
line3 = c("Variable", "Coeff", "CI", "Coeff", "CI", "Coeff", "CI"),
stringsAsFactors = FALSE
)
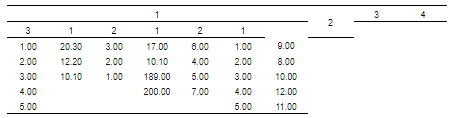
bind_rows(list(model_1 = model1, model_2 = model2, model_3 = model3), .id = 'model') %>%
pivot_wider(id_cols = variable, names_from = model, values_from = c(coeff, ci)) %>%
select(variable, coeff_model_1, ci_model_1,
coeff_model_2, ci_model_2, coeff_model_3, ci_model_3) %>%
flextable(col_keys = my_header$col_keys) %>%
set_header_df(mapping = my_header, key = "col_keys") %>%
theme_booktabs() %>%
merge_v(part = "header") %>%
merge_h(part = "header") %>%
align(align = "center", part = "all") %>%
colformat_num(na_str = "")输出
会话信息
R> sessionInfo()
R version 4.0.2 (2020-06-22)
Platform: x86_64-apple-darwin17.0 (64-bit)
Running under: macOS  10.16

Matrix products: default
LAPACK: /Library/Frameworks/R.framework/Versions/4.0/Resources/lib/libRlapack.dylib

locale:
[1] en_US.UTF-8/en_US.UTF-8/en_US.UTF-8/C/en_US.UTF-8/en_US.UTF-8

attached base packages:
[1] stats     graphics  grDevices utils     datasets  methods   base

other attached packages:
 [1] flextable_0.5.11 forcats_0.5.0    stringr_1.4.0    dplyr_1.0.2      purrr_0.3.4      readr_1.3.1
 [7] tidyr_1.1.2      tibble_3.0.3     ggplot2_3.3.2    tidyverse_1.3.0

loaded via a namespace (and not attached):
 [1] tidyselect_1.1.0  xfun_0.16         haven_2.3.1       colorspace_1.4-1  vctrs_0.3.2       generics_0.0.2
 [7] htmltools_0.5.0   viridisLite_0.3.0 yaml_2.2.1        base64enc_0.1-3   utf8_1.1.4        plotly_4.9.2.1
[13] rlang_0.4.7       pillar_1.4.4      glue_1.4.2        withr_2.2.0       DBI_1.1.0         gdtools_0.2.2
[19] dbplyr_1.4.3      uuid_0.1-4        modelr_0.1.7      readxl_1.3.1      lifecycle_0.2.0   munsell_0.5.0
[25] gtable_0.3.0      cellranger_1.1.0  zip_2.1.1         rvest_0.3.5       htmlwidgets_1.5.1 evaluate_0.14
[31] knitr_1.30        fansi_0.4.1       broom_0.7.0       Rcpp_1.0.5        backports_1.1.6   scales_1.1.1
[37] jsonlite_1.7.1    fs_1.4.1          systemfonts_0.2.1 hms_0.5.3         digest_0.6.25     stringi_1.4.6
[43] grid_4.0.2        cli_2.0.2         tools_4.0.2       magrittr_1.5      lazyeval_0.2.2    crayon_1.3.4
[49] pkgconfig_2.0.3   ellipsis_0.3.1    data.table_1.13.0 xml2_1.3.2        reprex_0.3.0      lubridate_1.7.9
[55] rmarkdown_2.2     officer_0.3.14    assertthat_0.2.1  httr_1.4.2        rstudioapi_0.11   R6_2.4.1
[61] compiler_4.0.2 https://stackoverflow.com/questions/64894173
复制相似问题
腾讯云开发者

Copyright © 2013 - 2026 Tencent Cloud. All Rights Reserved. 腾讯云 版权所有
深圳市腾讯计算机系统有限公司 ICP备案/许可证号:粤B2-20090059 ![]() 粤公网安备44030502008569号
粤公网安备44030502008569号
腾讯云计算(北京)有限责任公司 京ICP证150476号 | 京ICP备11018762号