
R:按颜色和ID选择
R:按颜色和ID选择
提问于 2020-11-24 00:31:49
我在R中有以下数据
Data_I_Have <- data.frame(

    "Node_A" = c("John", "John", "John", "Peter", "Peter", "Peter", "Tim", "Kevin", "Adam", "Adam", "Xavier"),
    "Node_B" = c("Claude", "Peter", "Tim", "Tim", "Claude", "Henry", "Kevin", "Claude", "Tim", "Henry", "Claude"),
    " Place_Where_They_Met" = c("Chicago", "Boston", "Seattle", "Boston", "Paris", "Paris", "Chicago", "London", "Chicago", "London", "Paris"),
  "Years_They_Have_Known_Each_Other" = c("10", "10", "1", "5", "2", "8", "7", "10", "3", "3", "5"),
  "What_They_Have_In_Common" = c("Sports", "Movies", "Computers", "Computers", "Video Games", "Sports", "Movies", "Computers", "Sports", "Sports", "Video Games")
)

additional_data_about_people <- data.frame(

    "Person" = c("John", "Peter", "Tim", "Kevin", "Adam", "Xacier", "Claude", "Henry"),
   "Job" = c("Teacher", "Lawyer", "Accountant", "Engineer", "Teacher", "Lawyer", "Engineer", "Lawyer"),
"Age" = c("50", "51", "61", "56", "65", "65", "54", "50"),
"Favorite_Food" = c("pizza", "pizza", "tacos", "pizza", "ice cream", "sushi", "sushi", "pizza")
)
使用这些信息,我创建了一个交互式图表,您可以在其中“按ID选择”
library(igraph)
library(dplyr)
library(visNetwork)


graph_file <- data.frame(Data_I_Have$Node_A, Data_I_Have$Node_B)


colnames(graph_file) <- c("Data_I_Have$Node_A", "Data_I_Have$Node_B")

graph <- graph.data.frame(graph_file, directed=F)
graph <- simplify(graph)


nodes <- data.frame(id = V(graph)$name, title = V(graph)$name)
nodes <- nodes[order(nodes$id, decreasing = F),]

colors = data.frame( "id" = c("John", "Peter", "Tim", "Kevin", "Adam", "Xavier", "Claude", "Henry"),
                     "color" = c("red", "blue", "green", "black", "red", "blue", "black", "blue") )

nodes <- merge(nodes, colors, by = "id")
edges <- get.data.frame(graph, what="edges")[1:2]

visNetwork(nodes, edges) %>%   visIgraphLayout(layout = "layout_with_fr") %>%
  visOptions(highlightNearest = TRUE, nodesIdSelection = TRUE)
可以修改代码,使您可以选择“颜色”而不是"id":
 nodes$color = colors$color
 nodes <- data.frame(id = V(graph)$name, title = V(graph)$name)
 nodes <- nodes[order(nodes$id, decreasing = F),]

 colors = data.frame( "id" = c("John", "Peter", "Tim", "Kevin", "Adam", "Xavier", "Claude", "Henry"),
                      "color" = c("red", "blue", "green", "black", "red", "blue", "black", "blue") )

 nodes <- merge(nodes, colors, by = "id")
 edges <- get.data.frame(graph, what="edges")[1:2]

 visNetwork(nodes, edges,  main = "A really simple example", width = "100%") %>%   visIgraphLayout(layout = "layout_with_fr") %>%
     visOptions(highlightNearest = TRUE, nodesIdSelection = TRUE) %>% visOptions(selectedBy = "color")
有没有办法把这两者结合在一起?你能有两个搜索栏,一个是ID,另一个是颜色?
    visNetwork(nodes, edges,  main = "A really simple example", width = "100%") %>%   visIgraphLayout(layout = "layout_with_fr") %>%
     visOptions(highlightNearest = TRUE, nodesIdSelection = TRUE) %>% visOptions(selectedBy = "color")

visNetwork(nodes, edges,  main = "A really simple example", width = "100%") %>%   visIgraphLayout(layout = "layout_with_fr") %>%
    visOptions(highlightNearest = TRUE, nodesIdSelection = TRUE) %>%
visLegend()就像这样:https://imgur.com/a/Y9yY0Q7
谢谢
回答 1
Stack Overflow用户
回答已采纳
发布于 2020-11-24 17:31:33
尝试将代码的最后一部分更改为
visNetwork(nodes, edges, main = "test", width = "100%") %>%
  visIgraphLayout(layout = "layout_with_fr") %>%
  visOptions(highlightNearest = TRUE, nodesIdSelection = TRUE,
             selectedBy = list(multiple = TRUE, variable = "color"))
其结果是
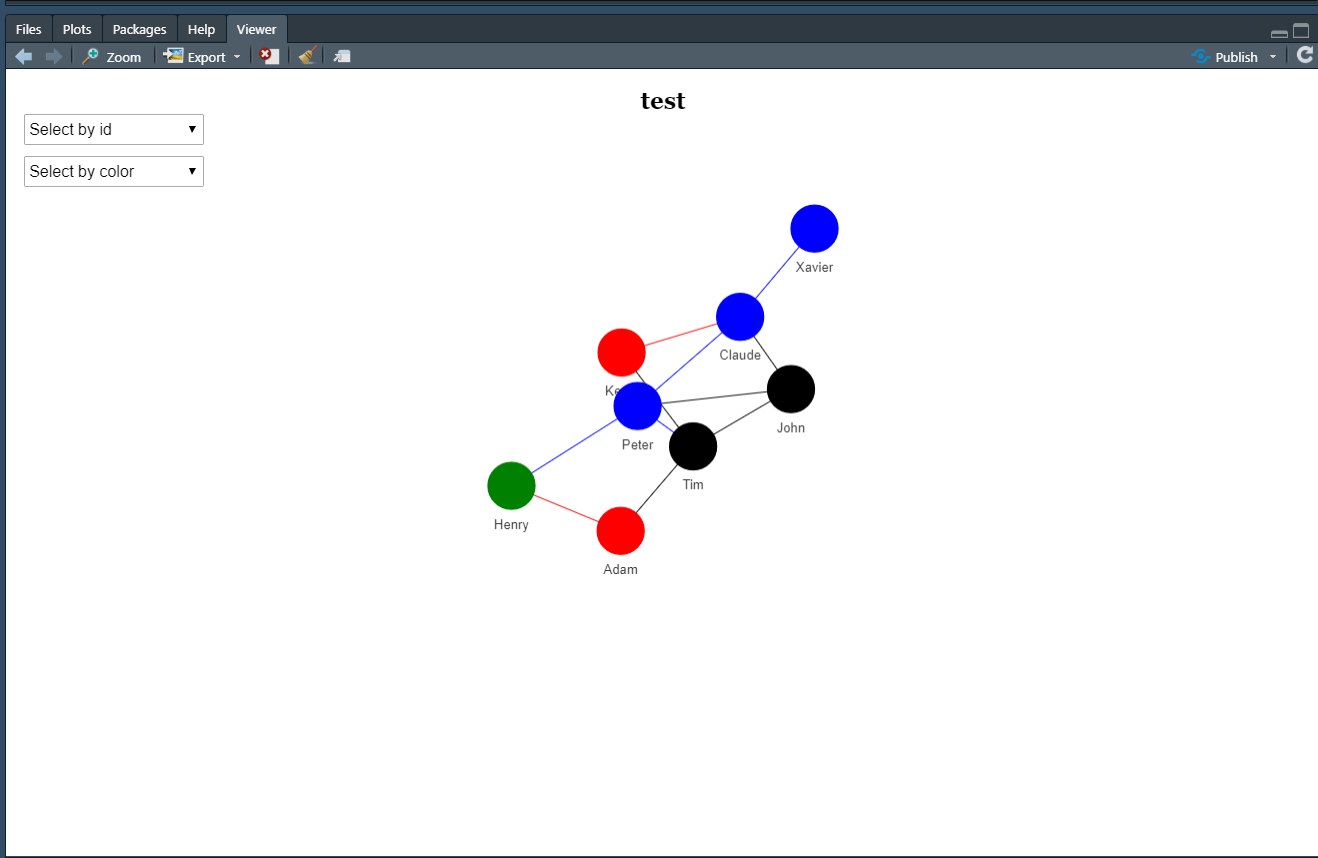
如果您想要添加一个图例,也许您应该重新配置您的dataframe并检查@Daman注释的链接。
页面原文内容由Stack Overflow提供。腾讯云小微IT领域专用引擎提供翻译支持
原文链接:
https://stackoverflow.com/questions/64978594
复制相关文章
相似问题
腾讯云开发者

Copyright © 2013 - 2026 Tencent Cloud. All Rights Reserved. 腾讯云 版权所有
深圳市腾讯计算机系统有限公司 ICP备案/许可证号:粤B2-20090059 ![]() 粤公网安备44030502008569号
粤公网安备44030502008569号
腾讯云计算(北京)有限责任公司 京ICP证150476号 | 京ICP备11018762号