
Cartopy:“numpy.ndarray”和“numpy.ndarray”--人口素养的地理制图
Cartopy:“numpy.ndarray”和“numpy.ndarray”--人口素养的地理制图
提问于 2020-12-04 05:56:41
这是我所拥有的数据集,在清理和排除其他数据后,我就这样做了一个集合-
我打算用cartopy绘制地理图
我正在采取的步骤如下:
- 从shapefile获取状态的名称。
- 创建一张地图
- 从shapefile绘制状态
- 添加功能的函数
- 绘制图
以下是cartopy python3中的代码
进口模块-
import pandas as pd
from itertools import groupby
from __future__ import division
import operator
import matplotlib.pyplot as plt
import matplotlib.cm
%matplotlib inline
from matplotlib.cbook import CallbackRegistry
import cartopy.crs as ccrs
from cartopy.feature import ShapelyFeature
import cartopy.io.shapereader as shpreader
from matplotlib.patches import Polygon
from matplotlib.collections import PatchCollection
from matplotlib.colors import Normalize
import plotly.graph_objects as go
import numpy as np
import seaborn as sns
import mathstates_group = states_group.copy()
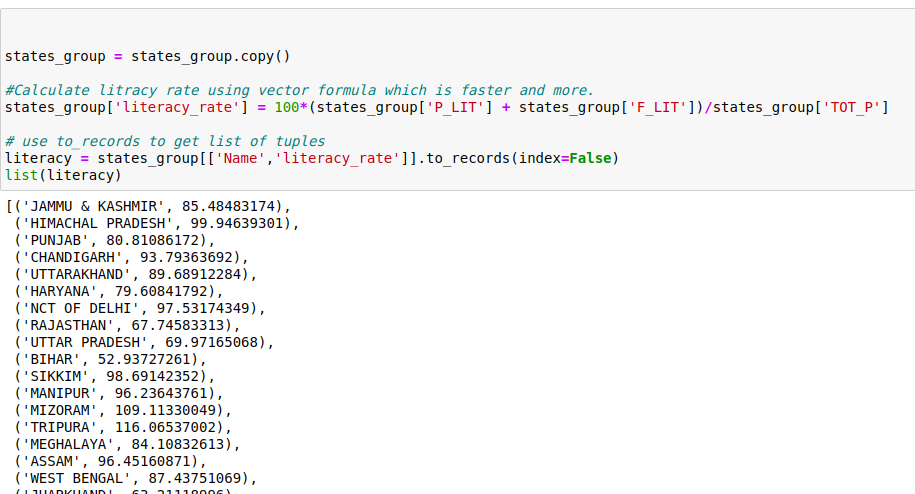
#Calculate litracy rate using vector formula which is faster and more.
states_group['literacy_rate'] = 100*(states_group['P_LIT'] + states_group['F_LIT'])/states_group['TOT_P']
# use to_records to get list of tuples
literacy = states_group[['Name','literacy_rate']].to_records(index=False)
list(literacy)
states= shpreader.Reader('/home/user/Downloads/India_SHP/INDIA.shp')
states= states.records()
states=next(states)
#print(type(states.attributes))
#print(sorted(states.attributes.keys()))创建一个图表-
crs=ccrs.PlateCarree()
extent=[68.60,97.23,35.40,6.33]

def draw_india(ax):
    ax.set_extent(extent)
    ax.coastlines()


fig,ax=plt.subplots(1,1,figsize=(6,8),subplot_kw=dict(projection=crs))
draw_india(ax)
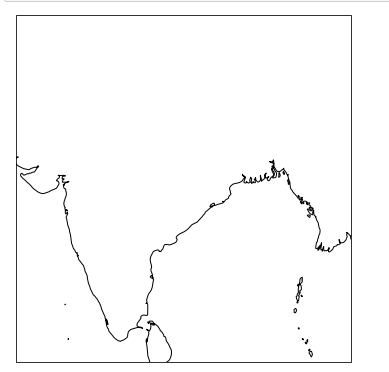
这是我打算得到的输出。
def choropleth(ax, literacy, cmap_name):
    # We need to normalize the values before we can
    # use the colormap.
    #values = [state.attributes[attr] for state in states ]
    norm = Normalize(
        vmin=min(literacy), vmax=max(literacy))
    cmap = plt.cm.get_cmap(cmap_name)
    for state in states:
        v = state.attributes[literacy['literacy_rate']]
 #ERROR-TypeError: unhashable type: 'numpy.ndarray'
        sp = ShapelyFeature([state.geometry], crs,
                            edgecolor='k',
                            facecolor=cmap(norm(v)))
        ax.add_feature(sp)


fig, ax = plt.subplots(
    1, 1, figsize=(10, 16),
    subplot_kw=dict(projection=crs))
draw_india(ax)                     #Draw india's graph
choropleth(ax, literacy, 'Reds')    #passing literacy(list)
ax.set_title('Literacy')
注意:
链接到- 记事本
链接到- 非洲参考代码
链接到- 形状文件和数据集
编辑:
问题在于函数literacy中的数据结构.So,而不是传递数据帧,而只是传递具有预期值的列现在.So新函数如下所示-
def choropleth(ax, literacy, cmap_name):
    # We need to normalize the values before we can
    # use the colormap.
    #values = [state.attributes[attr] for state in states ]
    norm = Normalize(
    vmin=min(literacy), vmax=max(literacy))
    cmap = plt.cm.get_cmap(cmap_name)
    for state in states:
#Error Here on this line
        v = state.attributes[literacy]
        sp = ShapelyFeature([state.geometry], crs,
                            edgecolor='k',
                            facecolor=cmap(norm(v)))
        ax.add_feature(sp)
fig, ax = plt.subplots(1, 1, figsize=(10, 16),
    subplot_kw=dict(projection=crs))
draw_india(ax)
choropleth(ax, literacy['literacy_rate'], 'Reds')
ax.set_title('Literacy')
但是,对于传递的数据结构类型,仍然会出现错误。
TypeError: unhashable type: 'list'回答 1
Stack Overflow用户
发布于 2020-12-04 17:23:10
问题是数据结构literacy。您需要将一个列表或数组传递给matplotlib.colors.Normalize。您可以通过提取数字识字值来解决这个问题,如下所示:
    norm = Normalize(
vmin=min(literacy['literacy_rate']), vmax=max(literacy['literacy_rate']))这样,您将传递一个numpy数组literacy['literacy_rate']。
array([ 79.9703704 ,  74.98720319,  96.10132857, ..., 101.62102523,
100.12902706, 105.12942069])而不是带有字符串和数字的结构literacy
rec.array([('India',  79.9703704 ), ('India',  74.98720319),
       ('India',  96.10132857), ..., ('Karaikal', 101.62102523),
       ('Karaikal', 100.12902706), ('Karaikal', 105.12942069)],
dtype=[('Name', 'O'), ('literacy_rate', '<f8')])页面原文内容由Stack Overflow提供。腾讯云小微IT领域专用引擎提供翻译支持
原文链接:
https://stackoverflow.com/questions/65138642
复制相关文章
相似问题
腾讯云开发者

Copyright © 2013 - 2026 Tencent Cloud. All Rights Reserved. 腾讯云 版权所有
深圳市腾讯计算机系统有限公司 ICP备案/许可证号:粤B2-20090059 ![]() 粤公网安备44030502008569号
粤公网安备44030502008569号
腾讯云计算(北京)有限责任公司 京ICP证150476号 | 京ICP备11018762号