
如何找到对应于FDR=0.05给定分布A和空分布的值?
如何找到对应于FDR=0.05给定分布A和空分布的值?
提问于 2020-12-22 19:04:54
我有两个相关向量:一个表示实际相关性,另一个表示置换相关(空分布)。我希望找到对应于FDR为0.05的相关值。
更新方法
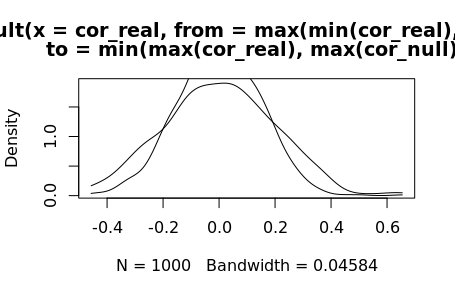
cor_real=rnorm(1000,0,sd=0.2)
cor_null=rnorm(1000,0,sd=0.15)

d_real=density(cor_real,from=max(min(cor_real),min(cor_null)),to=min(max(cor_real),max(cor_null)))
d_null=density(cor_null,from=max(min(cor_real),min(cor_null)),to=min(max(cor_real),max(cor_null)))
# here we ensure that the x values are comparable between the two densities

plot(d_real)
lines(d_null)
然后,要找到对应于FDR = 0.05的相关值,我的猜测是:
ratios=d_null$y/d_real$y
d_real$x[which(round(ratios,2)==.05)]
[1] 0.5694628 0.5716372 0.5868581 0.5890325 0.5912069
# this the the correlation value(s) that corresponds to a 5% chance of a false positive
这样做对吗?
例如:
cor_real=rnorm(100,0.25,sd=0.1)
cor_null=rnorm(100,0.2,sd=0.1)

h_real=hist(cor_real,plot=F)
h_null=hist(cor_null,plot=F)

plot(h_null,col=rgb(1,0,0,.5),xlim=c(0,1),ylim=c(0,max(h_real$counts))) # in red
plot(h_real,col=rgb(0,.5,.5,0.25),add=T) # in blue
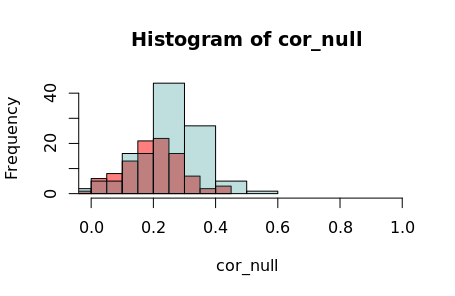
我认为这是当两个直方图的频率比= 0.05 (null:real)时,但我不能100%肯定。
如何找到对应于FDR = 0.05的相关值,从而“访问”空和实发行版?
回答 1
Stack Overflow用户
回答已采纳
发布于 2020-12-22 22:56:17
密度不完全正确,因为1.没有将n和from, to设置为相同,2.它只计算了一个bin的假阳性数/假阴性数。
错误发现率定义为FP / (FP + TP)。也看看这个post。一旦我们把这两个关联放在同一个向量中,我们就可以计算出,标签和排序:
set.seed(321)
cor_real=rnorm(1000,0,sd=0.2)
cor_null=rnorm(1000,0,sd=0.15)

df = data.frame(rho = c(cor_real,cor_null),
                type = rep(c(TRUE,FALSE),each=1000))
df$rho = abs(df$rho)
df = df[order(df$rho,decreasing=TRUE),]

df$FP = cumsum(df$type == FALSE)
df$TP = cumsum(df$type == TRUE)

df$FDR = df$FP / (df$FP + df$TP)
如果你看看结果,
head(df,25)
           rho  type FP TP        FDR
366  0.5822139  TRUE  0  1 0.00000000
247  0.5632078  TRUE  0  2 0.00000000
298  0.5594879  TRUE  0  3 0.00000000
147  0.5460875  TRUE  0  4 0.00000000
781  0.5373146  TRUE  0  5 0.00000000
760  0.5367116  TRUE  0  6 0.00000000
797  0.5216281  TRUE  0  7 0.00000000
569  0.5204598  TRUE  0  8 0.00000000
374  0.5200687  TRUE  0  9 0.00000000
744  0.5101275  TRUE  0 10 0.00000000
864  0.5058457  TRUE  0 11 0.00000000
227  0.4997959  TRUE  0 12 0.00000000
66   0.4993164  TRUE  0 13 0.00000000
14   0.4886520  TRUE  0 14 0.00000000
830  0.4840573  TRUE  0 15 0.00000000
261  0.4765394  TRUE  0 16 0.00000000
1163 0.4703764 FALSE  1 16 0.05882353
27   0.4661862  TRUE  1 17 0.05555556
965  0.4633883  TRUE  1 18 0.05263158
530  0.4608271  TRUE  1 19 0.05000000
96   0.4575683  TRUE  1 20 0.04761905
851  0.4563224  TRUE  1 21 0.04545455
922  0.4516161  TRUE  1 22 0.04347826
343  0.4511517  TRUE  1 23 0.04166667
在abs(rho) >= 0.4511517中,您有一个FP和23个TP,给您的FDR为0.0416。低于FDR 0.05。所以你可以在这里设定你的绝对截止点。
您所举的示例很难检验,因为两者都是几乎相同的空假设,只有不同的sd。在现实生活中,最有可能的是我们需要模拟数据来找出我们在零假设下得到的相关性。你会发现上面的计算应该运行得很好。
页面原文内容由Stack Overflow提供。腾讯云小微IT领域专用引擎提供翻译支持
原文链接:
https://stackoverflow.com/questions/65414439
复制相关文章
相似问题
腾讯云开发者

Copyright © 2013 - 2026 Tencent Cloud. All Rights Reserved. 腾讯云 版权所有
深圳市腾讯计算机系统有限公司 ICP备案/许可证号:粤B2-20090059 ![]() 粤公网安备44030502008569号
粤公网安备44030502008569号
腾讯云计算(北京)有限责任公司 京ICP证150476号 | 京ICP备11018762号