
SHAP TreeExplainer for RandomForest multiclass: shap_values[i]是什么?
我试图绘制图形这是我的代码rnd_clf是一个RandomForestClassifier
import shap
explainer = shap.TreeExplainer(rnd_clf)
shap_values = explainer.shap_values(X)
shap.summary_plot(shap_values[1], X) 我知道shap_values[0]是负的,shap_values[1]是正的。
但是对于多类RandomForestClassifier呢?我将rnd_clf分类为以下之一:
'Gusto','Kestrel 200 SCI旧路自行车‘,'Vilano铝路自行车21速岛野’,'Fixie‘。
如何确定shap_values[i]的哪个索引对应于输出的哪个类?
回答 1
Stack Overflow用户
发布于 2021-01-03 19:46:13
如何确定shap_valuesi的哪个索引对应于输出的哪个类?
shap_values[i]是I类的SHAP值。I‘’th类更多的是您使用的编码模式的问题:LabelEncoder、pd.factorize等等。
你可以尝试以下几点作为线索:
from sklearn.preprocessing import LabelEncoder

labels = [
    "Gusto",
    "Kestrel 200 SCI Older Road Bike",
    "Vilano Aluminum Road Bike 21 Speed Shimano",
    "Fixie",
]
le = LabelEncoder()
y = le.fit_transform(labels)
encoding_scheme = dict(zip(y, labels))
pprint(encoding_scheme){0: 'Fixie',
1: 'Gusto',
2: 'Kestrel 200 SCI Older Road Bike',
3: 'Vilano Aluminum Road Bike 21 Speed Shimano'}所以,例如,这个特殊情况下的shap_values[3]是'Vilano Aluminum Road Bike 21 Speed Shimano'
为了进一步理解如何解释SHAP值,让我们准备一个包含100个特性和10个类的多类分类的合成数据集:
from sklearn.datasets import make_classification
from sklearn.ensemble import RandomForestClassifier
from sklearn.model_selection import train_test_split
from shap import TreeExplainer
from shap import summary_plot

X, y = make_classification(1000, 100, n_informative=8, n_classes=10)
X_train, X_test, y_train, y_test = train_test_split(X, y, random_state=42)
print(X_train.shape)(750, 100)在这一点上,我们有训练数据集的750行,100个特征,和10个类别。
让我们训练RandomForestClassifier并把它喂给TreeExplainer
clf = RandomForestClassifier(n_estimators=100, max_depth=3)
clf.fit(X_train, y_train)
explainer = TreeExplainer(clf)
shap_values = np.array(explainer.shap_values(X_train))
print(shap_values.shape)(10, 750, 100)10 :类数。所有SHAP值被组织成10个数组,每个类一个数组。
750 :数据点数目。我们有每个数据池的局部SHAP值。
100 :功能数目。我们每个特性都有SHAP值。
例如,对于Class 3,您将拥有:
print(shap_values[3].shape)(750, 100)750:每个数据池的SHAP值
100:每个功能的SHAP值贡献
最后,您可以运行一个健全检查,以确保来自模型的真实预测与shap所预测的相同。
为此,我们将(1)交换shap_values的前2个维度,(2)对所有特性的每个类的SHAP值进行汇总,(3)将SHAP值添加到基值:
shap_values_ = shap_values.transpose((1,0,2))

np.allclose(
    clf.predict_proba(X_train),
    shap_values_.sum(2) + explainer.expected_value
)True然后,您可以继续使用summary_plot,它将显示基于每个类的SHAP值的功能排名。对于第三班,这将是:
summary_plot(shap_values[3],X_train)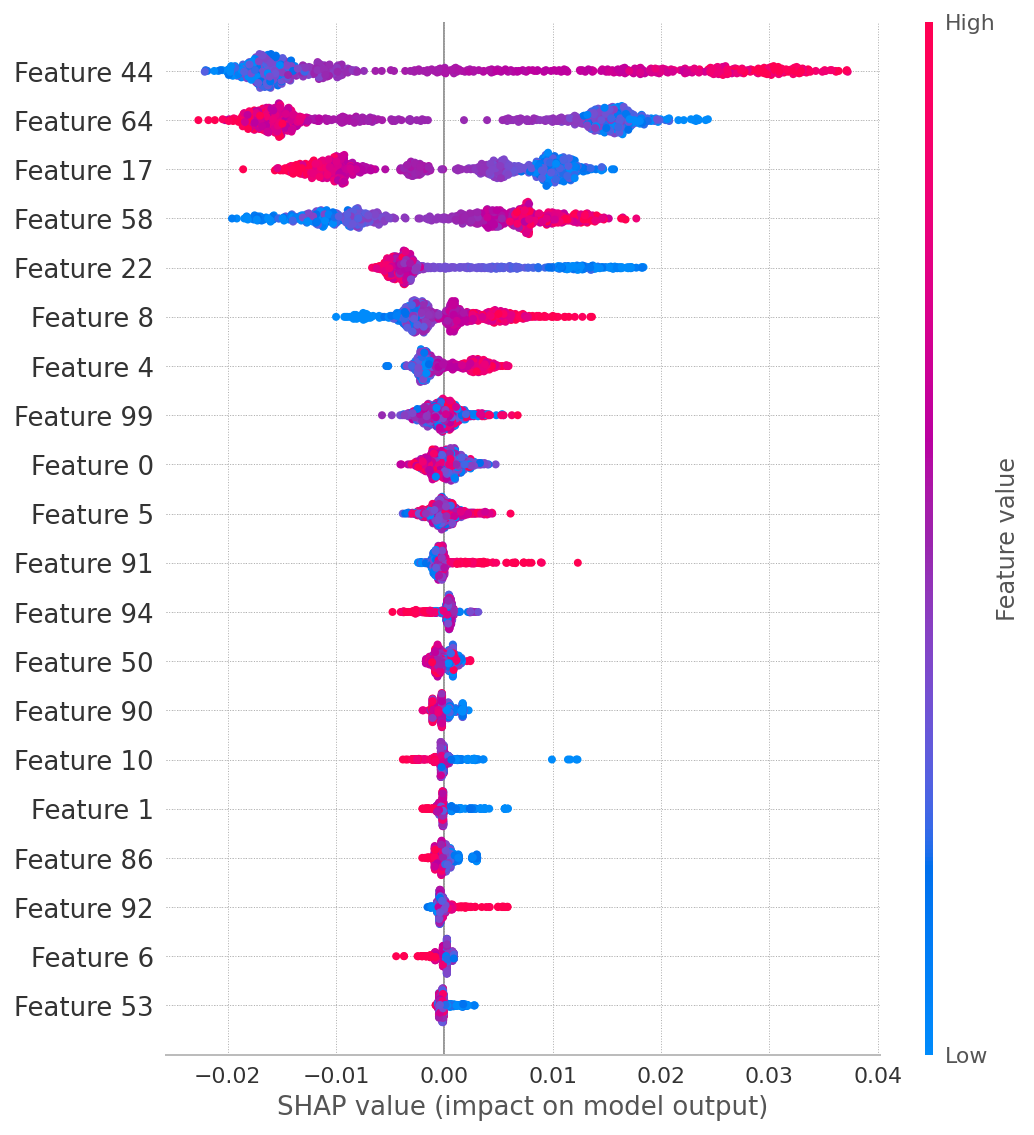
其解释如下:
基于SHAP贡献的3类最有影响力的特性的
- 是16,59,24
特性15的
- 值较低的值往往会导致更高的SHAP值(因此类标签的概率更高)
- 功能50,45,48在20个显示的
中影响力最小
https://stackoverflow.com/questions/65549588
复制相似问题
腾讯云开发者

Copyright © 2013 - 2026 Tencent Cloud. All Rights Reserved. 腾讯云 版权所有
深圳市腾讯计算机系统有限公司 ICP备案/许可证号:粤B2-20090059 ![]() 粤公网安备44030502008569号
粤公网安备44030502008569号
腾讯云计算(北京)有限责任公司 京ICP证150476号 | 京ICP备11018762号