
随机低时最低图低
随机低时最低图低
提问于 2021-01-04 11:54:54
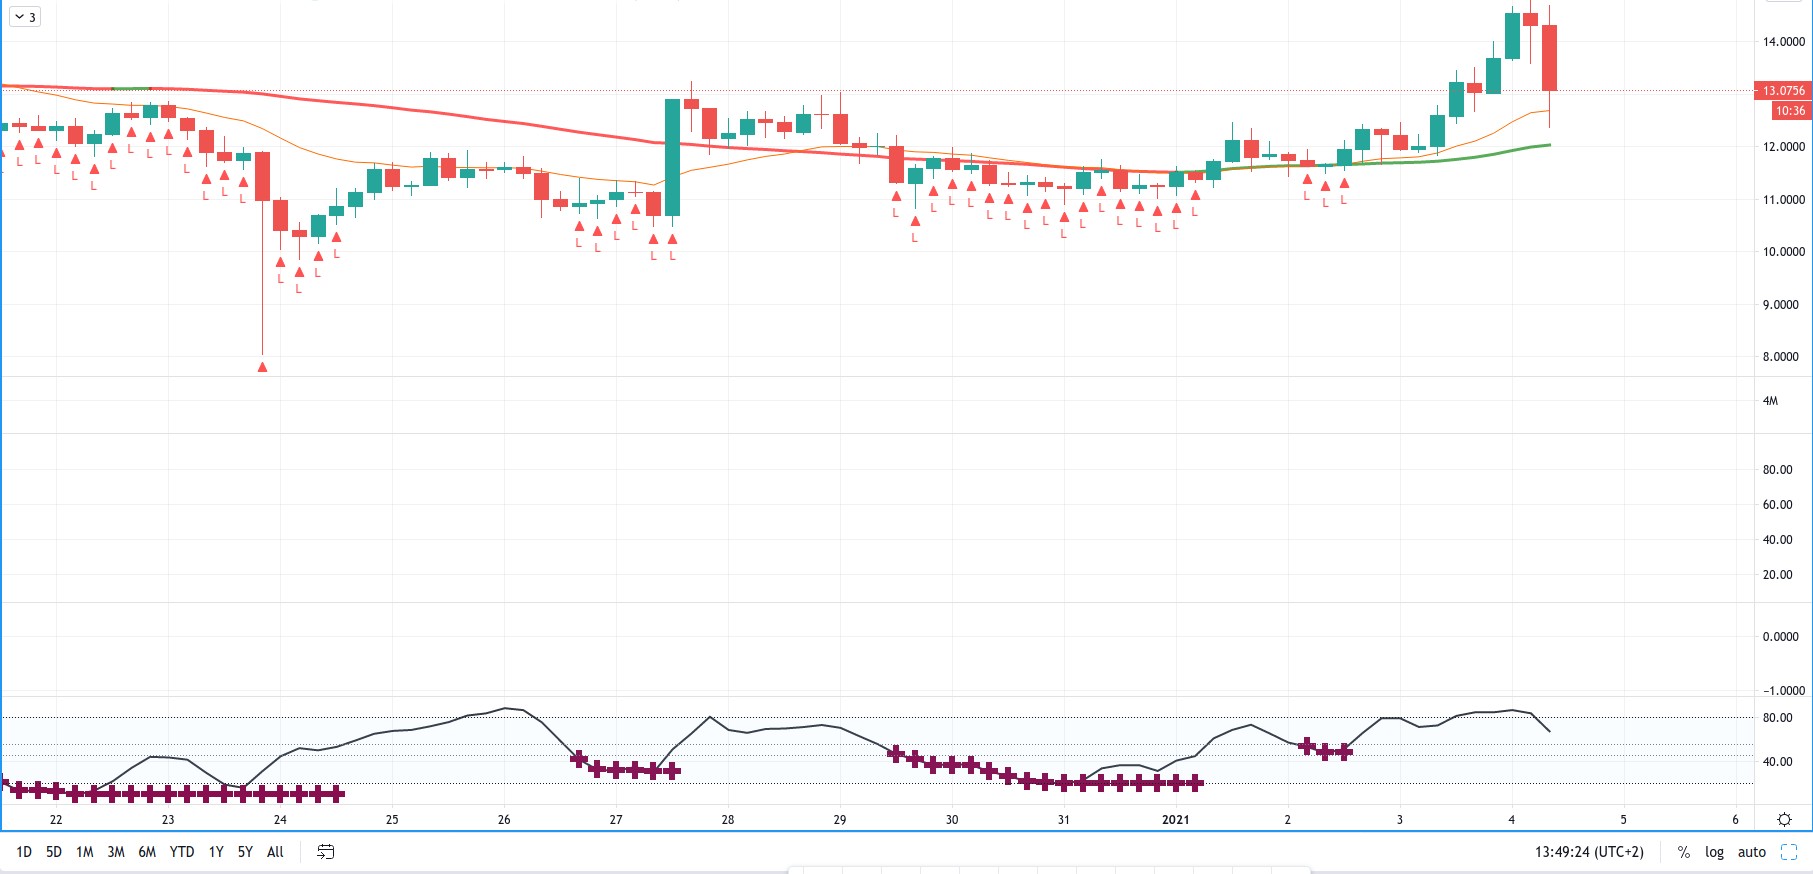
当随机K值低于55时,我想画出图表上的最低值。
到目前为止我的代码是:
//@version=4
study(title="Lows", shorttitle="Low of low", overlay=true)

periodK = input(14, title="K", minval=1)

smoothK = input(3, title="Smooth", minval=1)
k = sma(stoch(close, high, low, periodK), smoothK)

lowestInCycle(series) =>
    min=101.0
    if series < 55
        if series < min
            min := series
    else
        min:=na
    min != 101.0

plotshape(lowestInCycle(k), title="Test", location=location.belowbar, color=color.red, transp=0, style=shape.triangleup, text="L")
我还修改了随机指标,以显示交叉时,它是低于55,并变得越来越低,在K上,这只是为了在图像中参考。
I只想在每一个‘55下随机集群’中标出最低的价格。
这是如何做到的呢?任何帮助都是非常感谢的。
PS。不用说,我是个初学者。从我写了这篇文章开始,我就可以把代码做得更好。
提前感谢
回答 1
Stack Overflow用户
回答已采纳
发布于 2021-01-04 23:48:13
这使用一个标签来标识低于55个周期中最低的k,因此您将被限制在只看到最后500个周期的标签。当指示器实时运行时,k值最低的条形图可能会发生变化,直到55下周期结束为止。最低k值的值与标签一起打印:
//@version=4
study(title="Lows", shorttitle="Low of low", overlay=true, max_labels_count = 500)
periodK = input(14, title="K", minval=1)
smoothK = input(3, title="Smooth", minval=1)
k = sma(stoch(close, high, low, periodK), smoothK)
lowestInCycle(series) =>
_xDn = crossunder(series, 55)
_xUp = crossover(series, 55)
var label _label = na
var float _min = na
if _xDn
// We enter a cycle; create a new label (each cycle has its own label).
_min := series
_label := label.new(bar_index, close, tostring(_min, "#.##"), yloc = yloc.belowbar, color = color.red, textcolor = color.red, style = label.style_arrowup)
// This is just so that all `if` blocks return a float, otherwise compiler complains.
float(na)
else if _xUp
// We exit a cycle.
_min := na
else if not na(_min)
// We are in a cycle; get new minimal value if there is one.
_min := min(_min, series)
if change(_min) < 0
// We are in a cycle and a new minimum was found; update the cycle's label.
label.set_x(_label, bar_index)
label.set_text(_label, tostring(_min, "#.##"))
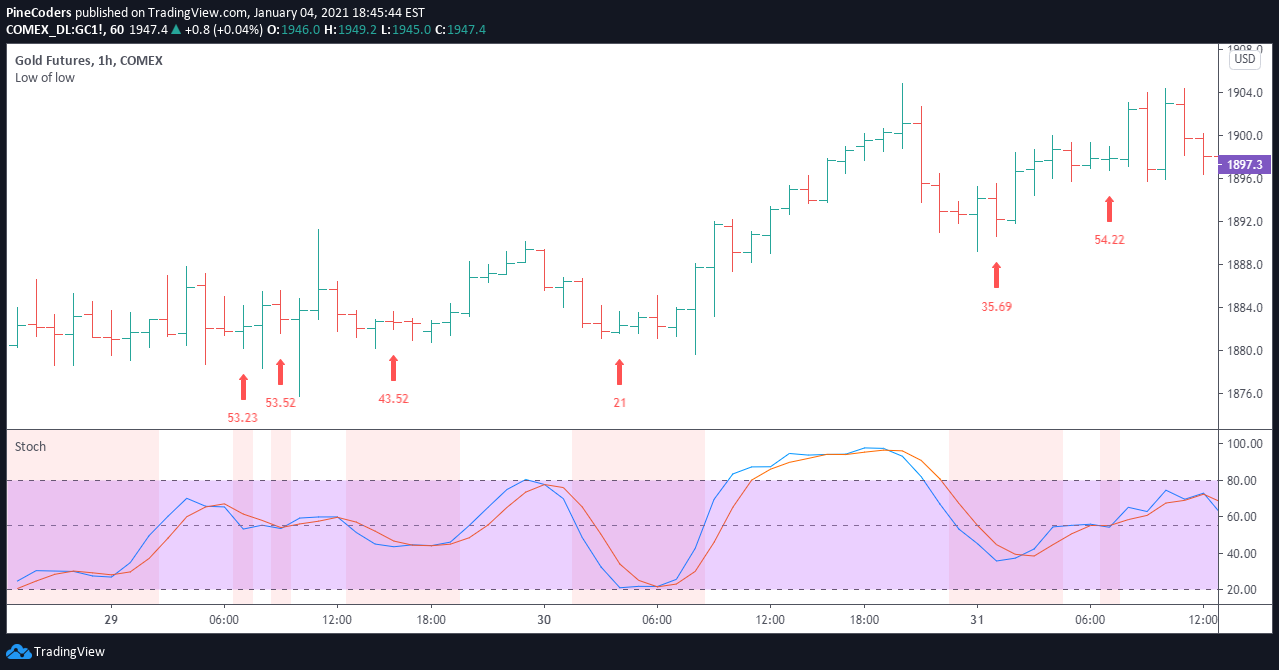
lowestInCycle(k)
// We need to plot something, otherwise compiler complains.
plot(na)这显示了代码在运行中,下面的Stoch显示了具有红色背景的循环:
页面原文内容由Stack Overflow提供。腾讯云小微IT领域专用引擎提供翻译支持
原文链接:
https://stackoverflow.com/questions/65562299
复制相关文章
相似问题
腾讯云开发者

Copyright © 2013 - 2026 Tencent Cloud. All Rights Reserved. 腾讯云 版权所有
深圳市腾讯计算机系统有限公司 ICP备案/许可证号:粤B2-20090059 ![]() 粤公网安备44030502008569号
粤公网安备44030502008569号
腾讯云计算(北京)有限责任公司 京ICP证150476号 | 京ICP备11018762号