
试图向d3添加标签时,无法找出文本标签
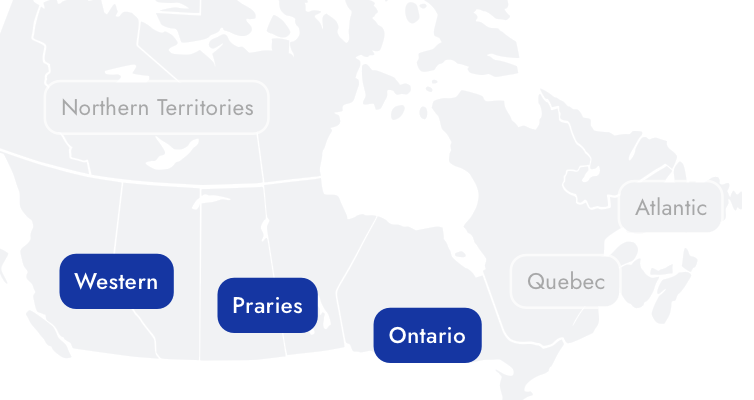
我想让我的地图看上去像这样
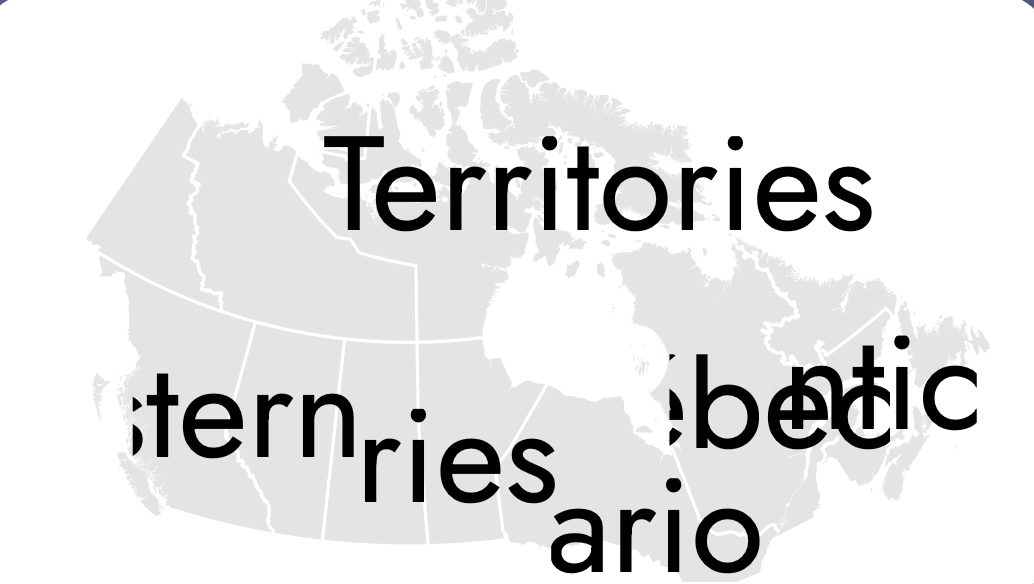
不幸的是,我的代码看起来是这样的,我不明白为什么我的文本节点如此庞大,而不是我想要的方式。
这是我要去检查我的小提琴的代码
这段代码似乎没有产生人类可读的标签。
grp
  .append("text")
  .attr("fill", "#000")
  .style("text-anchor", "middle")
  .attr("font-family", "Verdana")
  .attr("x", 0)
  .attr("y", 0)
  .attr("font-size", "10")
  .text(function (d, i) {
    return name;
  });
这是我的完整代码:
     var width = 500,
            height = 275,
            centered;

          var projection = d3.geo
            .conicConformal()
            .rotate([103, 0])
            .center([0, 63])
            .parallels([49, 77])
            .scale(500)
            .translate([width / 2.5, height / 2])
            .precision(0.1);

          var path = d3.geo.path().projection(projection);

          var svg = d3
            .select("#map-selector-app")
            .append("svg")
            .attr("viewBox", `0 0 ${width} ${height}`);
          // .attr("width", width)
          // .attr("height", height);

          svg
            .append("rect")
            .attr("class", "background-svg-map")
            .attr("width", width)
            .attr("height", height)
            .on("click", clicked);

          var g = svg.append("g");
          var json = null;
          var subregions = {
            Western: { centroid: null },
            Prairies: { centroid: null },
            "Northern Territories": { centroid: null },
            Ontario: { centroid: null },
            Québec: { centroid: null },
            Atlantic: { centroid: null },
          };

          d3.json(
            "https://gist.githubusercontent.com/KatFishSnake/7f3dc88b0a2fa0e8c806111f983dfa60/raw/7fff9e40932feb6c0181b8f3f983edbdc80bf748/canadaprovtopo.json",
            function (error, canada) {
              if (error) throw error;

              json = topojson.feature(canada, canada.objects.canadaprov);
              g.append("g")
                .attr("id", "provinces")
                .selectAll("path")
                .data(json.features)
                .enter()
                .append("path")
                .attr("d", path)
                .on("click", clicked);

              g.append("g")
                .attr("id", "province-borders")
                .append("path")
                .datum(
                  topojson.mesh(canada, canada.objects.canadaprov, function (
                    a,
                    b
                  ) {
                    return a !== b;
                  })
                )
                .attr("id", "province-borders-path")
                .attr("d", path);

              // g.select("g")
              //   .selectAll("path")
              //   .each(function (d, i) {
              //     var centroid = path.centroid(d);
              //   });

              Object.keys(subregions).forEach((rkey) => {
                var p = "";
                json.features.forEach(function (f, i) {
                  if (f.properties.subregion === rkey) {
                    p += path(f);
                  }
                });
                var tmp = svg.append("path").attr("d", p);
                subregions[rkey].centroid = getCentroid(tmp.node());
                subregions[rkey].name = rkey;
                tmp.remove();
              });

              Object.values(subregions).forEach(({ centroid, name }) => {
                var w = 80;
                var h = 30;

                var grp = g
                  .append("svg")
                  // .attr("width", w)
                  // .attr("height", h)
                  .attr("viewBox", `0 0 ${w} ${h}`)
                  .attr("x", centroid[0] - w / 2)
                  .attr("y", centroid[1] - h / 2);

                // grp
                //   .append("rect")
                //   .attr("width", 80)
                //   .attr("height", 27)
                //   .attr("rx", 10)
                //   .attr("fill", "rgb(230, 230, 230)")
                //   .attr("stroke-width", "2")
                //   .attr("stroke", "#FFF");

                grp
                  .append("text")
                  .attr("fill", "#000")
                  .style("text-anchor", "middle")
                  .attr("font-family", "Verdana")
                  .attr("x", 0)
                  .attr("y", 0)
                  .attr("font-size", "10")
                  .text(function (d, i) {
                    return name;
                  });

                // var group = g.append("g");
                // group
                //   .append("rect")
                //   .attr("x", centroid[0] - w / 2)
                //   .attr("y", centroid[1] - h / 2)
                //   .attr("width", 80)
                //   .attr("height", 27)
                //   .attr("rx", 10)
                //   .attr("fill", "rgb(230, 230, 230)")
                //   .attr("stroke-width", "2")
                //   .attr("stroke", "#FFF");
                // group
                //   .append("text")
                //   .attr("x", centroid[0] - w / 2)
                //   .attr("y", centroid[1] - h / 2)
                //   .text(function (d, i) {
                //     return name;
                //   });
              });

              // g.append("button")
              //   .attr("class", "wrap")
              //   .text((d) => d.properties.name);
            }
          );

          function getCentroid(element) {
            var bbox = element.getBBox();
            return [bbox.x + bbox.width / 2, bbox.y + bbox.height / 2];
          }

          function clicked(d) {
            var x, y, k;

            if (d && centered !== d) {
              // CENTROIDS for subregion provinces
              var p = "";
              json.features.forEach(function (f, i) {
                if (f.properties.subregion === d.properties.subregion) {
                  p += path(f);
                }
              });
              var tmp = svg.append("path");
              tmp.attr("d", p);
              var centroid = getCentroid(tmp.node());
              tmp.remove();

              // var centroid = path.centroid(p);
              x = centroid[0];
              y = centroid[1];
              k = 2;

              if (d.properties.subregion === "Northern Territories") {
                k = 1.5;
              }

              centered = d;
            } else {
              x = width / 2;
              y = height / 2;
              k = 1;
              centered = null;
            }

            g.selectAll("path").classed(
              "active",
              centered &&
                function (d) {
                  return (
                    d.properties &&
                    d.properties.subregion === centered.properties.subregion
                  );
                  // return d === centered;
                }
            );

            g.transition()
              .duration(650)
              .attr(
                "transform",
                "translate(" +
                  width / 2 +
                  "," +
                  height / 2 +
                  ")scale(" +
                  k +
                  ")translate(" +
                  -x +
                  "," +
                  -y +
                  ")"
              )
              .style("stroke-width", 1.5 / k + "px");
} .background-svg-map {
fill: none;
pointer-events: all;
}
#provinces {
fill: rgb(230, 230, 230);
}
#provinces > path:hover {
fill: #0630a6;
}
#provinces .active {
fill: #0630a6;
}
#province-borders-path {
fill: none;
stroke: #fff;
stroke-width: 1.5px;
stroke-linejoin: round;
stroke-linecap: round;
pointer-events: none;
} <script src="https://d3js.org/d3.v3.min.js"></script>
<script src="https://d3js.org/topojson.v1.min.js"></script>
<div id="map-selector-app"></div>
回答 1
Stack Overflow用户
发布于 2021-01-05 05:01:58
具有背景的标签的基本工作流程是:
- 定位父
g - 添加文本
- 添加矩形并根据父
g的边框设置其大小,然后将其移动到文本后面。
对于d3v3,我将在文本之前实际添加矩形,但在添加文本和已知所需大小之前不要对其进行样式化。如果我们在后面加上它,它就会出现在文本的前面。在d3v4中有一个方便的.lower()方法,它可以为我们将其向后移动,在d3v3中,有一些方法可以做到这一点,但是为了简单起见,为了确保矩形在文本后面,我将首先添加它
在我的示例中,我将在更基本的层次上偏离您的代码。我不打算追加子SVGs,因为这会给您带来一些调整大小的问题。另外,我将使用selectAll()/enter()循环,而不是使用循环来追加标签。这意味着我最终需要一个数据数组,而不是一个对象。为了帮助构建这个数组,我将使用一个对象--通过对json进行一次检查,我们可以构建一个区域列表,并为每个区域创建一个geojson特性。geojson特性很好,因为它允许我们使用path.centroid(),它允许我们在不需要额外代码的情况下找到特性的质心。
首先,我需要创建数据数组:
  var subregions = {};
  json.features.forEach(function(feature) {
     var subregion = feature.properties.subregion;
     // Have we already encountered this subregion? If not, add it.
     if(!(subregion in subregions)) {
        subregions[subregion] = {"type":"FeatureCollection", features: [] };
     }
     // For every feature, add it to the subregion featureCollection:
     subregions[subregion].features.push(feature);
  })
  // Convert to an array:
  subregions = Object.keys(subregions).map(function(key) {
    return { name: key, geojson: subregions[key] };
})现在,我们可以用标准的g selectAll/enter语句追加父d3:
  // Create a parent g for each label:
  var subregionsParent  = g.selectAll(null)
    .data(subregions)
    .enter()
    .append("g")
    .attr("transform", function(d) {
       // position the parent, so we don't need to position each child based on geographic location:
       return "translate("+path.centroid(d.geojson)+")";
    })
现在我们可以添加文本和矩形:
      // add a rectangle to each parent `g`
      var boxes = subregionsParent.append("rect");

      // add text to each parent `g`
      subregionsParent.append("text")
        .text(function(d) { return d.name; })
        .attr("text-anchor","middle");

      // style the boxes based on the parent `g`'s bbox
      boxes
        .each(function() {
            var bbox = this.parentNode.getBBox();
            d3.select(this)
              .attr("width", bbox.width + 10)
              .attr("height", bbox.height +10)
              .attr("x", bbox.x - 5)
              .attr("y", bbox.y - 5)
              .attr("rx", 10)
              .attr("ry", 10)
              .attr("fill","#ccc")
        })
您可以看到质心方法(无论是使用现有的函数还是使用path.centroid()),考虑到地图上的一些重叠,在布局方面可能会有点傻。您可以修改它--可能在数据中添加偏移量,或者在添加文本时添加手动异常。虽然在更大的SVG上不应该有重叠。众所周知,注释是很难完成的。
以下是我的结果:
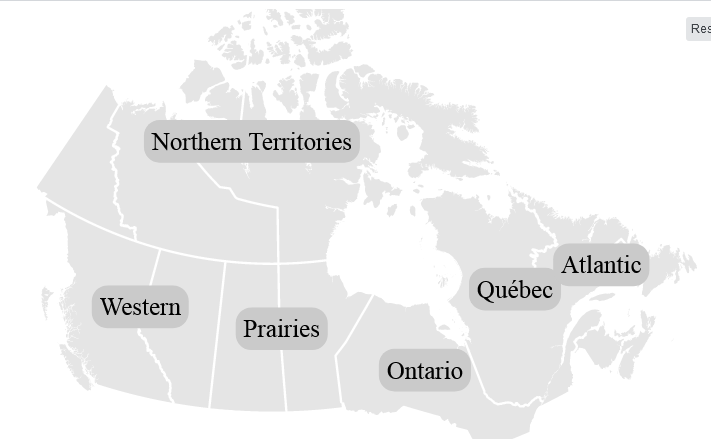
还有一个片段来演示(我已经删除了大量不必要的代码,以创建一个简单的示例,但它应该保留示例的功能):
var width = 500,
  height = 275,
  centered;

var projection = d3.geo.conicConformal()
  .rotate([103, 0])
  .center([0, 63])
  .parallels([49, 77])
  .scale(500)
  .translate([width / 2.5, height / 2])

var path = d3.geo.path().projection(projection);

var svg = d3
  .select("#map-selector-app")
  .append("svg")
  .attr("viewBox", `0 0 ${width} ${height}`);

var g = svg.append("g");

d3.json("https://gist.githubusercontent.com/KatFishSnake/7f3dc88b0a2fa0e8c806111f983dfa60/raw/7fff9e40932feb6c0181b8f3f983edbdc80bf748/canadaprovtopo.json",
            function (error, canada) {
              if (error) throw error;

    json = topojson.feature(canada, canada.objects.canadaprov);
    var provinces = g.append("g")
     .attr("id", "provinces")
     .selectAll("path")
     .data(json.features)
     .enter()
     .append("path")
     .attr("d", path)
     .on("click", clicked);

    g.append("g")
      .attr("id", "province-borders")
      .append("path")
      .datum(topojson.mesh(canada, canada.objects.canadaprov, function (a,b) { return a !== b; }))
      .attr("id", "province-borders-path")
      .attr("d", path);

    // Add labels:
    // Get the data:
      var subregions = {};
      json.features.forEach(function(feature) {
         var subregion = feature.properties.subregion;

         if(!(subregion in subregions)) {
            subregions[subregion] = {"type":"FeatureCollection", features: [] };
         }
         subregions[subregion].features.push(feature);
      })
      // Convert to an array:
      subregions = Object.keys(subregions).map(function(key) {
        return { name: key, geojson: subregions[key] };
      })

      // Create a parent g for each label:
      var subregionsParent  = g.selectAll(null)
        .data(subregions)
        .enter()
        .append("g")
        .attr("transform", function(d) {
           return "translate("+path.centroid(d.geojson)+")";
        })

      var boxes = subregionsParent.append("rect");

      subregionsParent.append("text")
        .text(function(d) { return d.name; })
        .attr("text-anchor","middle");

      boxes
        .each(function() {
            var bbox = this.parentNode.getBBox();
            d3.select(this)
              .attr("width", bbox.width + 10)
              .attr("height", bbox.height +10)
              .attr("x", bbox.x - 5)
              .attr("y", bbox.y - 5)
              .attr("rx", 10)
              .attr("ry", 10)
              .attr("fill","#ccc")
        })
        // End labels.


          function getCentroid(element) {
            var bbox = element.getBBox();
            return [bbox.x + bbox.width / 2, bbox.y + bbox.height / 2];
          }

          function clicked(d) {
            var x, y, k;

            if (d && centered !== d) {
              // CENTROIDS for subregion provinces
              var p = "";
              json.features.forEach(function (f, i) {
                if (f.properties.subregion === d.properties.subregion) {
                  p += path(f);
                }
              });
              var tmp = svg.append("path");
              tmp.attr("d", p);
              var centroid = getCentroid(tmp.node());
              tmp.remove();

              x = centroid[0];
              y = centroid[1];
              k = 2;

              if (d.properties.subregion === "Northern Territories") {
                k = 1.5;
              }

              centered = d;
            } else {
              x = width / 2;
              y = height / 2;
              k = 1;
              centered = null;
            }

            g.selectAll("path").classed(
              "active",
              centered &&
                function (d) {
                  return (
                    d.properties &&
                    d.properties.subregion === centered.properties.subregion
                  );
                }
            );

            g.transition()
              .duration(650)
              .attr("transform","translate(" + width / 2 + "," + height / 2 +")scale(" +
                  k +")translate(" + -x + "," + -y + ")"
              )
              .style("stroke-width", 1.5 / k + "px");
          }
}).background-svg-map {
fill: none;
pointer-events: all;
}
#provinces {
fill: rgb(230, 230, 230);
}
#provinces > path:hover {
fill: #0630a6;
}
#provinces .active {
fill: #0630a6;
}
#province-borders-path {
fill: none;
stroke: #fff;
stroke-width: 1.5px;
stroke-linejoin: round;
stroke-linecap: round;
pointer-events: none;
}<script src="https://d3js.org/d3.v3.min.js"></script>
<script src="https://d3js.org/topojson.v1.min.js"></script>
<div id="map-selector-app"></div>
https://stackoverflow.com/questions/65572677
复制相似问题
腾讯云开发者

Copyright © 2013 - 2026 Tencent Cloud. All Rights Reserved. 腾讯云 版权所有
深圳市腾讯计算机系统有限公司 ICP备案/许可证号:粤B2-20090059 ![]() 粤公网安备44030502008569号
粤公网安备44030502008569号
腾讯云计算(北京)有限责任公司 京ICP证150476号 | 京ICP备11018762号