
如何绘制TF.Dataset类标签的直方图
如何绘制TF.Dataset类标签的直方图
提问于 2021-01-06 10:53:56
我用TF.CsvDataset从磁盘中加载数据。将数据绘制为
#This is the transformation function applied on loaded data before displaying histogram.
def preprocess(*fields):
    print(len(fields))
    features=tf.stack(fields[:-1])
    labels=tf.stack([int(x) for x in fields[-1:]])
    return features,labels  # x, y

for features,label in train_ds.take(1000):
#  print(features[0])
plt.hist(features.numpy().flatten(), bins = 101)
我得到了这个直方图
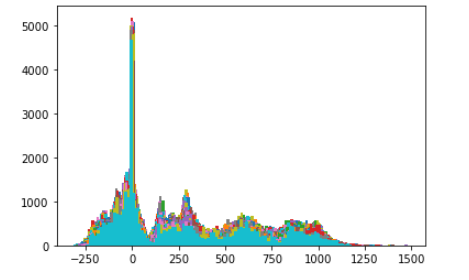
但是,我想根据二进制类标签绘制712个特性值的分布图。也就是说,当类标签为0时,特性1、2或3的值是多少。
如何用pyplot实现这一点?
我读过下面的文章,但是,没有任何帮助。
回答 1
Stack Overflow用户
回答已采纳
发布于 2021-01-06 13:50:45
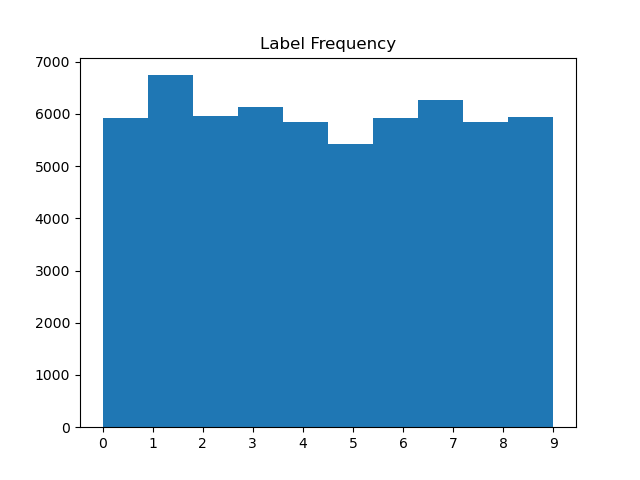
您可以使用np.fromiter并获取所有标签。然后您只需将标签列表传递给plt.hist。
import tensorflow as tf
import numpy as np
import matplotlib.pyplot as plt

train, test = tf.keras.datasets.mnist.load_data()

ds = tf.data.Dataset.from_tensor_slices(train)

vals = np.fromiter(ds.map(lambda x, y: y), float)

plt.hist(vals)
plt.xticks(range(10))
plt.title('Label Frequency')
plt.show()
页面原文内容由Stack Overflow提供。腾讯云小微IT领域专用引擎提供翻译支持
原文链接:
https://stackoverflow.com/questions/65594438
复制相关文章
相似问题
腾讯云开发者

Copyright © 2013 - 2026 Tencent Cloud. All Rights Reserved. 腾讯云 版权所有
深圳市腾讯计算机系统有限公司 ICP备案/许可证号:粤B2-20090059 ![]() 粤公网安备44030502008569号
粤公网安备44030502008569号
腾讯云计算(北京)有限责任公司 京ICP证150476号 | 京ICP备11018762号