
地理点超出预期边界
地理点超出预期边界
提问于 2021-01-14 10:55:42
我有一个点几何的美国位置包含在一个GeoDataFrame。我想把这画成美国地图上的零散图。我的代码是:
import numpy as np
import geopandas as gpd
import libpysal
import contextily as ctx
import matplotlib.pyplot as plt
from shapely.ops import cascaded_union
gdf = gpd.GeoDataFrame(point_geometry, geometry='geometry')
boundary = gpd.read_file(libpysal.examples.get_path('us48.shp'))
fig, ax = plt.subplots(figsize=(50, 50))
boundary.plot(ax=ax, color="gray")
gdf.plot(ax=ax, markersize=3.5, color="black")
ax.axis("off")
plt.axis("equal")
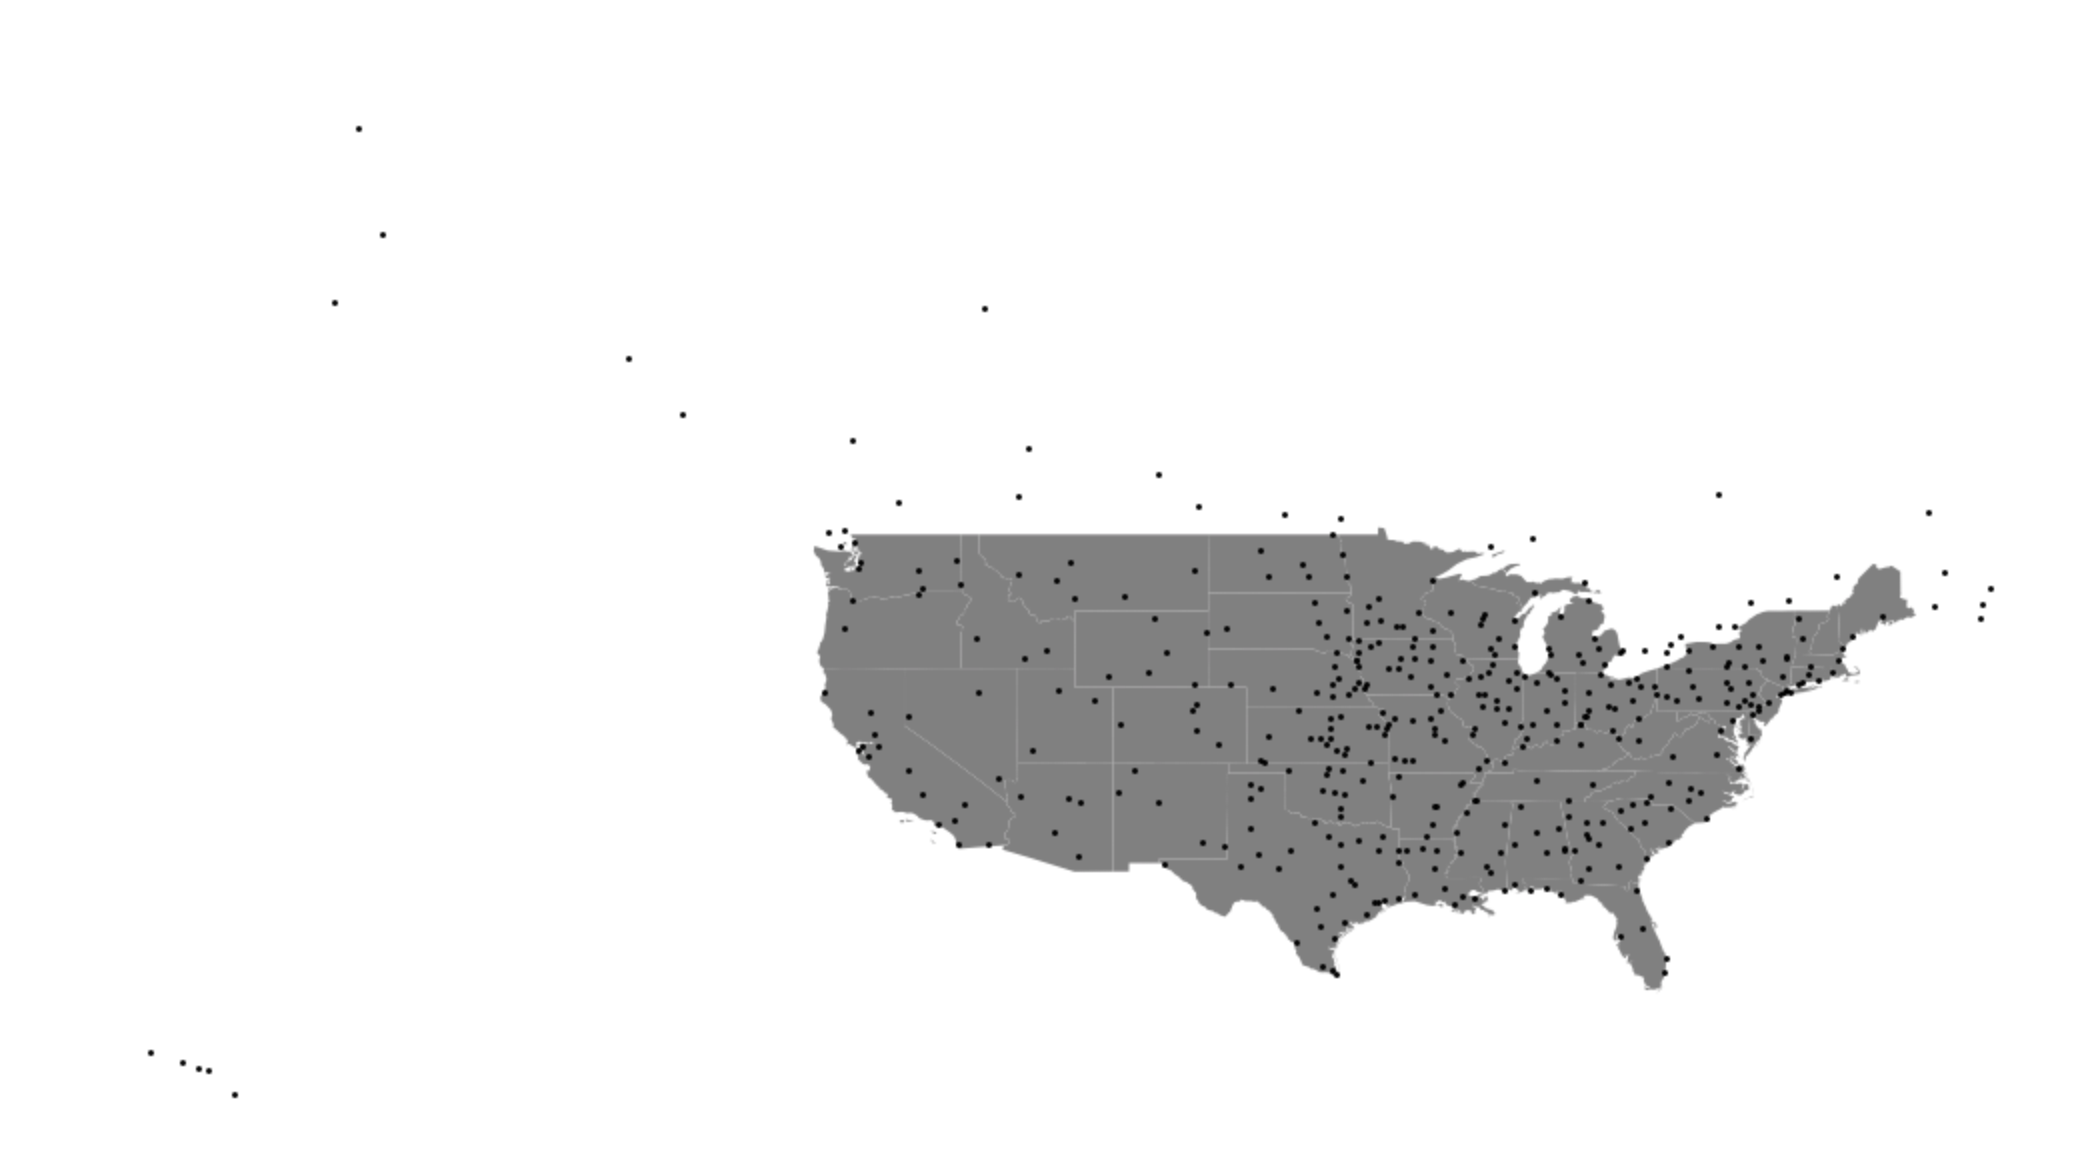
plt.show()在图上检查时,这些点超出了我的预期范围。我遗漏了什么吗?我需要创建一个边界来限制点的散布吗?
回答 1
Stack Overflow用户
回答已采纳
发布于 2021-01-15 07:09:15
情节看上去不错。我想你想把美国之外的分数排除在外。夏威夷、阿拉斯加和加拿大显然都有这几点。
通过使用point几何学、gdf和polygon几何学、边界,您可以创建一个合适的边界来限制点的散布。
# need this module
from shapely.ops import cascaded_union

# create the conterminous USA polygon
poly_union = cascaded_union([poly for poly in boundary.geometry])

# get a selection from `gdf`, taking points within `poly_union`
points_within = gdf[gdf.geometry.within(poly_union)]现在,points_within是一个geodataframe,您可以用它来绘制而不是gdf。
points_within.plot(ax=ax, markersize=3.5, color="black")页面原文内容由Stack Overflow提供。腾讯云小微IT领域专用引擎提供翻译支持
原文链接:
https://stackoverflow.com/questions/65717683
复制相关文章
相似问题
腾讯云开发者

Copyright © 2013 - 2026 Tencent Cloud. All Rights Reserved. 腾讯云 版权所有
深圳市腾讯计算机系统有限公司 ICP备案/许可证号:粤B2-20090059 ![]() 粤公网安备44030502008569号
粤公网安备44030502008569号
腾讯云计算(北京)有限责任公司 京ICP证150476号 | 京ICP备11018762号