
用mpf.plot mplfinance打印两点
用mpf.plot mplfinance打印两点
提问于 2021-01-31 09:23:23
我想在一个图表中打印一些枢轴点。但我在时间变量上有问题。
two_points =[(lastDate,lastPivot),(yesterday,lastPivot)]
mpf= mpf.plot(dfnew_plot,type='candle',alines= two_points)
但是时间变量lastDate和昨天没有相同的格式: lastDate = 2021-01-15 00:00:00
yesterday= 2021-01-30
lastDate = 2021-01-15 00:00:00
yesterday= 2021-01-30
我如何格式化lastDate和昨天的正确格式?
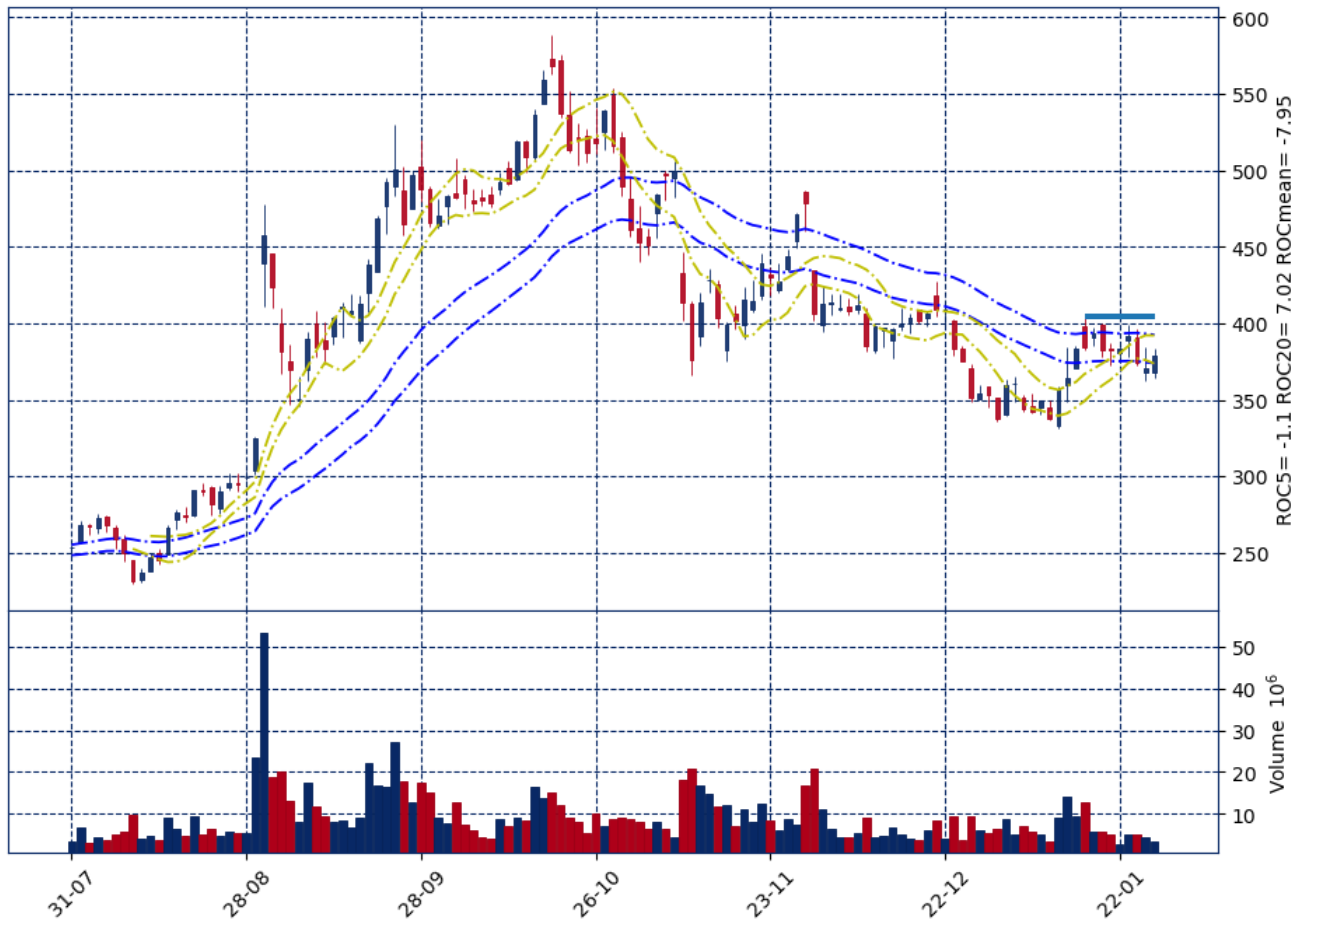
最终结果图如下。实际上,有时代码是有效的,有时是无效的:
mpf.plot(dfnew_plot,volume=True,style='starsandstripes',datetime_format=' %d-%m',alines=
two_points,addplot=apdict\
,xrotation=45,title=(stock),type='candle',\
ylabel='ROC5= '+(ROC5) +' ' +'ROC20= '+(ROC20)+ ' ' +'ROCmean= '+(ROCmean),figscale=1.5)
回答 1
Stack Overflow用户
发布于 2021-02-02 13:17:48
问题是在周末。昨天的变量比上一个指数日期要大。因此,最后的绘图日期(lastDate)比日期(昨天)要小。非常感谢你的支持。
页面原文内容由Stack Overflow提供。腾讯云小微IT领域专用引擎提供翻译支持
原文链接:
https://stackoverflow.com/questions/65977516
复制相关文章
相似问题
腾讯云开发者

Copyright © 2013 - 2026 Tencent Cloud. All Rights Reserved. 腾讯云 版权所有
深圳市腾讯计算机系统有限公司 ICP备案/许可证号:粤B2-20090059 ![]() 粤公网安备44030502008569号
粤公网安备44030502008569号
腾讯云计算(北京)有限责任公司 京ICP证150476号 | 京ICP备11018762号