
用ggpmisc在小面中正确定位ggpmisc
如何在不改变嵌入本身的宽度和高度的情况下,使用inset灵活地定位ggpmisc?
library(tidyverse)
library(sf)
library(ggpmisc)

#data
nc <- st_read(system.file("gpkg/nc.gpkg", package = "sf"), quiet = TRUE) %>%
  st_transform(st_crs(4326)) %>%
  st_cast('POLYGON')

#create timeseries data
nc_2 <- rbind(nc %>% mutate(timepoint = 1), nc %>% mutate(timepoint = 2))
#create base plot
nc_2_base <- ggplot(data = nc_2) +
  geom_sf(aes(fill = BIR74)) +
  coord_sf(xlim = c(-80, -76),
           ylim = c(32, 37), expand = FALSE)
#facet plot
nc_2_main <- nc_2_base + facet_wrap(~timepoint, dir = "h", ncol = 2)

#extract number of timepoints
nmax_rep_nc <- length(unique(nc_2$timepoint))

#create insets
insets_nc <- lapply(seq_len(nmax_rep_nc), function(i) {
  nc_2_base + ggforce::facet_wrap_paginate(~ timepoint, nrow = 1, ncol = 1, page = i) +
    coord_sf(xlim = c(-79.5, -78.5), ylim = c(34.5, 35.5)) +
    theme(strip.background = element_blank(),
          strip.text = element_blank(),
          axis.title = element_blank(),
          plot.background = element_blank(),
          legend.position = "none")
})要定位嵌入式,您需要创建一个带有tibble的x,y表示您想要的位置。在这里,我希望它们位于左下角,所以请指定x = 0.0和y = 0 (x,y可以是小插曲这里中的0 - 1 ),我希望嵌入体的大小为主地块(vp.width = 0.5, vp.height = 0.5)的50%:
insets_nc_tibble <- tibble(x = rep(0.0, nmax_rep_nc),
                           y = rep(0.0, nmax_rep_nc),
                           plot = insets_nc,
                           timepoint = unique(nc_2$timepoint))
#add inset to plot:
nc_2_main +
  geom_rect(xmin = -79.5, xmax = -78.5, ymin = 34.5, ymax = 35.5,
            fill = NA, colour = "red", size = 1.5) +
  geom_plot_npc(data = insets_nc_tibble,
                aes(npcx = x, npcy = y, label = plot,
                    vp.width = 0.5, vp.height = 0.5))
产生了这样的情节:
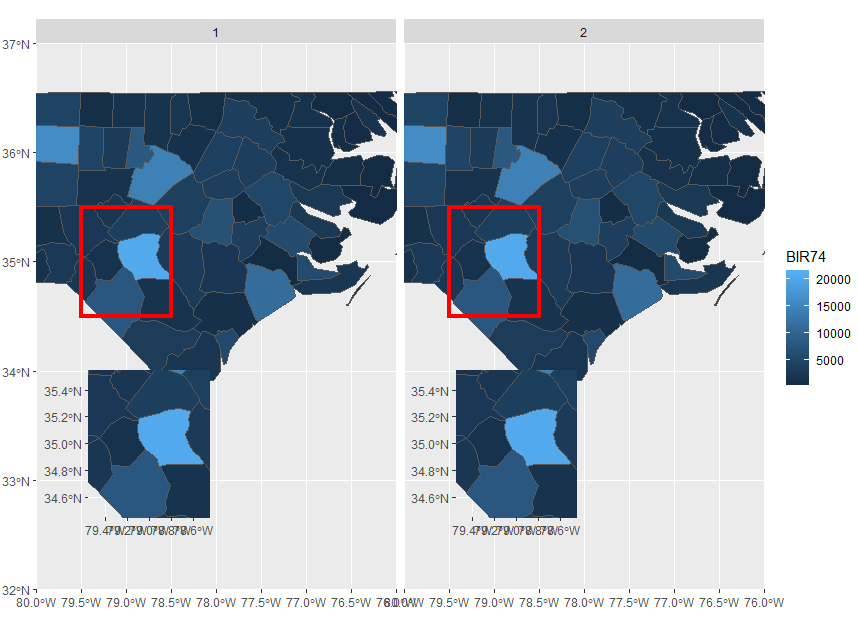
但是嵌入在左下角的(0, 0)并不像我想要的那样正确。我怎样才能保持这个大小,但移动它,使它直接在角落?
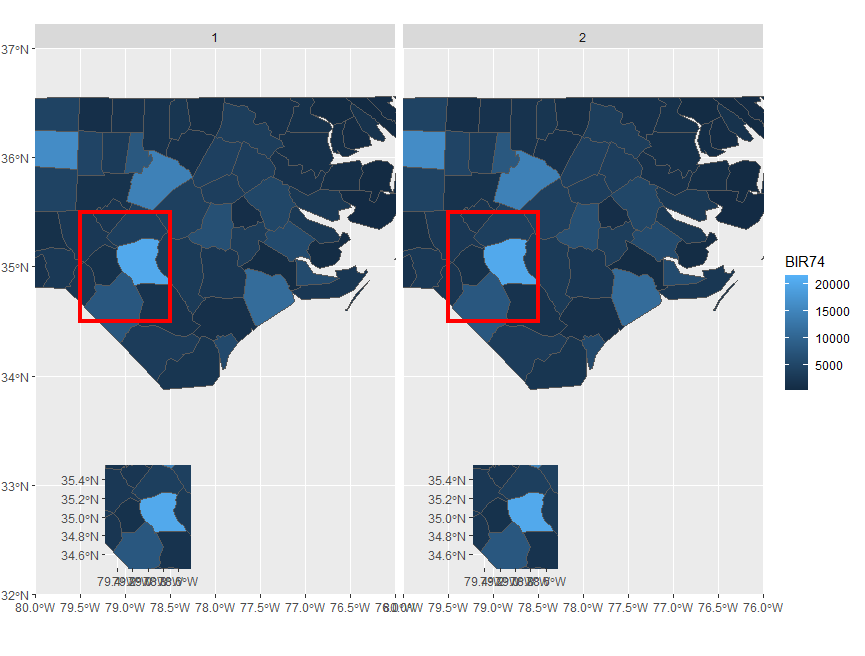
如果我缩小嵌入的大小,它似乎是有帮助的,但这是完全的尝试和错误,我不想缩小嵌入的大小。
#reduce size
nc_2_main +
  geom_rect(xmin = -79.5, xmax = -78.5, ymin = 34.5, ymax = 35.5,
            fill = NA, colour = "red", size = 1.5) +
  geom_plot_npc(data = insets_nc_tibble,
                aes(npcx = x, npcy = y, label = plot,
                    vp.width = 0.5, vp.height = 0.25))
这就产生了更好的位置,但不是我想要的正确大小的地块:
注意,您也可以按字符串指定角,但这没有帮助:
#insets_nc_tibble <- tibble(x = rep("left", nmax_rep_nc),
#                           y = rep("bottom", nmax_rep_nc),
#                           plot = insets_nc,
# timepoint = unique(nc_2$timepoint))这个问题是对我之前的答案和其他这里问题的跟进。
我不明白如何改变大小,改变位置。我认为指定x, y = 0, 0意味着嵌入的左下角应该设置为0, 0,但这里似乎不是这样吗?
有什么想法吗?
谢谢
回答 1
Stack Overflow用户
发布于 2021-02-07 00:10:13
这看起来像个窃听器。我将研究为什么x轴有0.5度的偏移。
下面是使用geom的非noc版本并将x坐标移至-0.5度的临时解决方案:
insets_nc_tibble1 <- tibble(x = rep(-80, nmax_rep_nc),
                            y = rep(31.5, nmax_rep_nc),
                            plot = insets_nc,
                            timepoint = unique(nc_2$timepoint))

#add inset to plot:
nc_2_main +
  geom_rect(xmin = -79.5, xmax = -78.5, ymin = 34.5, ymax = 35.5,
            fill = NA, colour = "red", size = 1.5) +
  geom_plot(data = insets_nc_tibble1,
            aes(x = x, y = y, label = plot),
            vp.width = 0.5, vp.height = 0.5)
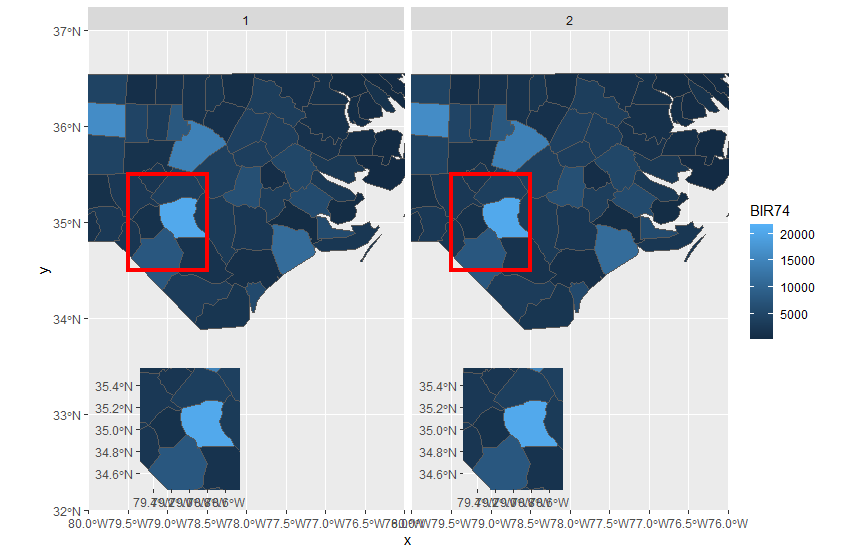
原因是渲染的绘图的网格视图大于绘图本身。无论这是'ggplot2‘中的一个特性还是一个bug,都很难说成是lat和lot,否则就会被扭曲。可以通过打印ggplot然后运行grid::showViewport()来查看。这似乎是使用固定坐标的结果,这样嵌入图就不能伸展以填充视图中的可用空间。
https://stackoverflow.com/questions/66045387
复制相似问题
腾讯云开发者

Copyright © 2013 - 2026 Tencent Cloud. All Rights Reserved. 腾讯云 版权所有
深圳市腾讯计算机系统有限公司 ICP备案/许可证号:粤B2-20090059 ![]() 粤公网安备44030502008569号
粤公网安备44030502008569号
腾讯云计算(北京)有限责任公司 京ICP证150476号 | 京ICP备11018762号