
geom_segment y-轴的重排顺序
geom_segment y-轴的重排顺序
提问于 2021-02-12 21:35:15
问题:想要按geom_segment的长度来排序ggplot。
数据
swimplot_response

 SUBJECT            RESPONSE ORD_RESP  STARTRESP    ENDRESP ORD DEATH  MAX_RESP
1        01            On Study        1  0.0000000 88.9000000   1     1 94.483871
2        01      Stable Disease        2  0.0000000  9.2333333   2     1 94.483871
3        01    Partial Response        3  9.2333333 21.0333333   3     1 94.483871
4        01   Complete Response        4 21.0333333 62.0333333   4     1 94.483871
5        01 Progressive Disease       -1 62.0333333 88.0000000   5     1 94.483871
6        01     Off Study/Alive        0 88.0000000 94.4838710   6     1 94.483871
7        02            On Study        1  0.0000000 93.5806452   1     1 93.806452
8        02      Stable Disease        2  0.0000000  1.9000000   2     1 93.806452
9        02 Progressive Disease       -1  1.9000000 93.5806452   3     1 93.806452
10       02     Off Study/Alive        0 93.5806452 93.8064516   4     1 93.806452
11       03            On Study        1  0.0000000  4.1290323   1     1  5.774194
12       03      Stable Disease        2  0.0000000  0.6666667   2     1  5.774194
13       03 Progressive Disease       -1  0.6666667  4.1290323   3     1  5.774194
14       03     Off Study/Alive        0  4.1290323  5.7741935   4     1  5.774194
15       04            On Study        1  0.0000000  2.5666667   1     1  5.607143
16       04      Stable Disease        2  0.0000000  2.5666667   2     1  5.607143
17       04 Progressive Disease       -1  2.5666667  5.6071429   3     1  5.607143
18       05            On Study        1  0.0000000 11.0645161   1     1 19.833333
19       05      Stable Disease        2  0.0000000  3.0000000   2     1 19.833333
20       05 Progressive Disease       -1  3.0000000 11.0645161   3     1 19.833333
21       05     Off Study/Alive        0 11.0645161 19.8333333   4     1 19.833333
,
- ,然后我用
MAX_RESP来细分。在这段代码中,我认为我已经解决了由MAX_RESP.
安排dfs的问题。
subj_18mos_resp <- swimplot_response %>%
  group_by(SUBJECT) %>%
  filter(MAX_RESP >= 18) %>%
  arrange(desc(MAX_RESP))

subj_18mos_resp

subj_18mos <- unique(subj_18mos_resp$SUBJECT)

subj_18mos_bev <- swimplot_bev %>%
  subset(SUBJECT %in% subj_18mos) %>%
        group_by(SUBJECT) %>%
        arrange(ORD, .by_group = TRUE)

subj_18mos_steroids <- swimplot_steroids %>%
  subset(SUBJECT %in% subj_18mos) %>%
        group_by(SUBJECT) %>%
        arrange(ORD, .by_group = TRUE)

subj_18mos_dose <- swimplot_dose %>%
  subset(SUBJECT %in% subj_18mos) %>%
        group_by(SUBJECT)

subj_18mos_resp

# A tibble: 66 x 8
# Groups:   SUBJECT [16]
   SUBJECT RESPONSE            ORD_RESP STARTRESP ENDRESP   ORD DEATH MAX_RESP
   <chr>   <chr>                  <dbl>     <dbl>   <dbl> <dbl> <dbl>    <dbl>
 1 01      On Study                   1      0      88.9      1     1     94.5
 2 01      Stable Disease             2      0       9.23     2     1     94.5
 3 01      Partial Response           3      9.23   21.0      3     1     94.5
 4 01      Complete Response          4     21.0    62.0      4     1     94.5
 5 01      Progressive Disease       -1     62.0    88        5     1     94.5
 6 01      Off Study/Alive            0     88      94.5      6     1     94.5
 7 02      On Study                   1      0      93.6      1     1     93.8
 8 02      Stable Disease             2      0       1.9      2     1     93.8
 9 02      Progressive Disease       -1      1.9    93.6      3     1     93.8
10 02      Off Study/Alive            0     93.6    93.8      4     1     93.8
# ... with 56 more rows- I还尝试按当前顺序将
SUBJECT转换为因子和级别,但这没有起作用。(错误消息包含在下面。)
subj_18mos_resp$SUBJECT <-  factor(levels = subj_18mos_resp$SUBJECT)

Error in `levels<-`(`*tmp*`, value = as.character(levels)) :
factor level [2] is duplicated我也尝试过在ggplot(aes())中包括subj_18mos_resp
我的绘图代码包括在下面,以及示例图的图像。
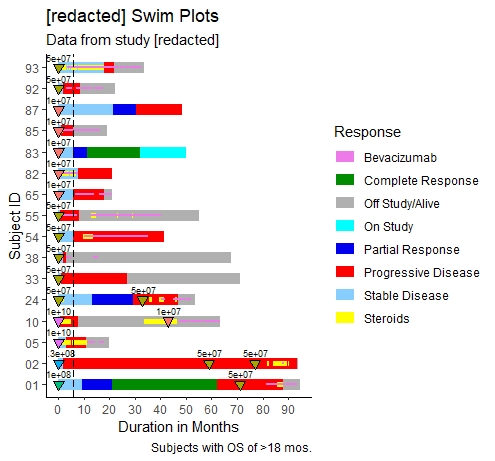
“全”游泳图代码(含剂量,bev,类固醇使用),适用于总生存期大于18 dose的受试者
SwimmerPlot_18mos_full <-  ggplot() +

  theme_classic() +

  geom_vline(xintercept = 6, colour = "black", linetype = "longdash",
             show.legend = FALSE) +

  geom_segment(data = subj_18mos_resp, aes(x = STARTRESP, xend = ENDRESP,
                                                  y = SUBJECT, yend = SUBJECT,
                                                  colour = RESPONSE),
               size = 4, show.legend = TRUE) +

  scale_colour_manual(values = response_color) +

  geom_segment(data = subj_18mos_steroids, aes(x = STARTROIDS, xend = ENDROIDS,
                                                y = SUBJECT, yend = SUBJECT,
                                                colour = STEROIDS),

               size = 2, linetype = 1, show.legend = TRUE) +

  geom_segment(data = subj_18mos_bev, aes(x = STARTBEV, xend = ENDBEV,
                                           y = SUBJECT, yend = SUBJECT,
                                           colour = BEV),
               size = 1, linetype = 1, show.legend = TRUE) +

  geom_point(data = subj_18mos_dose, aes(x = DUR, y = SUBJECT,
                                          fill = TREATMENT),
             shape = 25, size = 2.5, show.legend = FALSE) +

  labs(title = "Phase 1 GBM Swim Plots",
       subtitle = "Data from study [redacted]",
       caption = "Subjects with OS of >18 mos.",
       color = "Response") +

  scale_x_continuous(name = "Duration in Months", breaks = seq(0,90,10)) +

  ylab(label = "Subject ID") +

  scale_fill_discrete() +

  geom_vline(xintercept = 6, colour = "black", linetype = "longdash",
             show.legend = FALSE) +

  geom_text(aes(x=DUR, y=SUBJECT, label = TREATMENT), data = subj_18mos_dose,
            nudge_y = 0.5, nudge_x = 0.5, size = 2.5) +

  guides(fill = FALSE)

SwimmerPlot_18mos_full
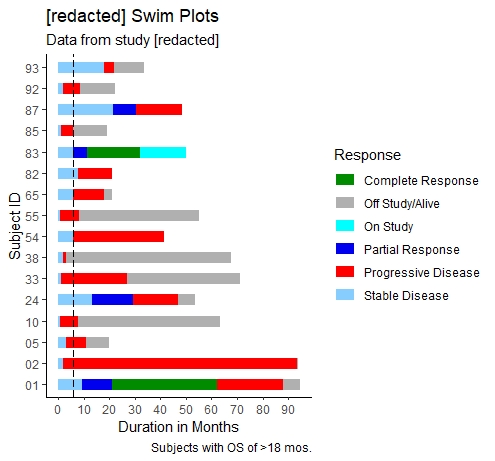
受试者>18莫斯反应
SwimmerPlot_18mos <-  ggplot() +

  geom_segment(data = subj_18mos_resp, aes(x = STARTRESP, xend = ENDRESP,
                 y = SUBJECT, yend = SUBJECT,
                 colour = RESPONSE),
             size = 4, show.legend = TRUE) +

  scale_colour_manual(values = response_color) +

  labs(title = "Phase 1 GBM Swim Plots",
       subtitle = "Data from study [redacted]",
       caption = "Subjects with OS of >18 mos.",
       color = "Response") +

  scale_x_continuous(name = "Duration in Months", breaks = seq(0,90,10)) +

  ylab(label = "Subject ID") +

  #Add dashed line at 6 month mark
  geom_vline(xintercept = 6, colour = "black", linetype = "longdash",
             show.legend = TRUE) +

  theme_classic()

SwimmerPlot_18mos回答 1
Stack Overflow用户
回答已采纳
发布于 2021-02-15 16:01:58
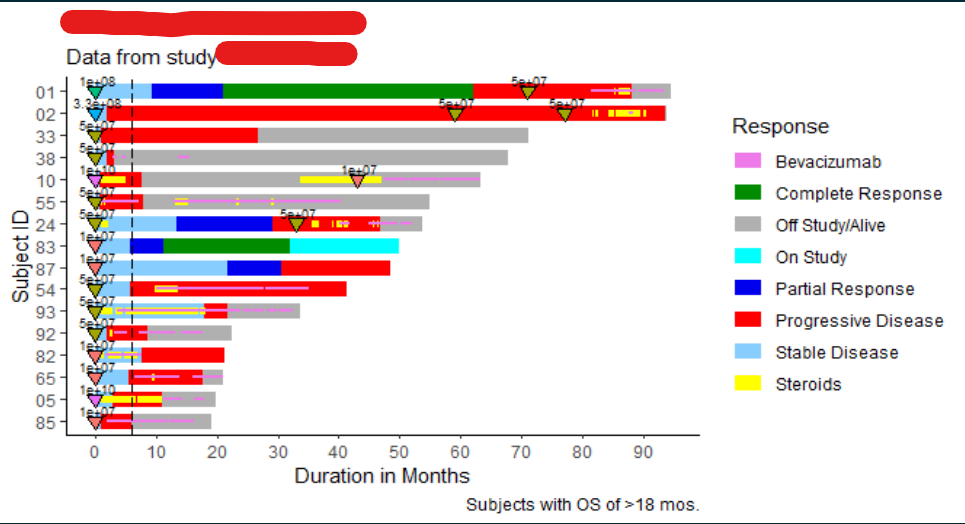
非常感谢格雷戈·托马斯!
最后,我通过升序和重构来安排MAX_RESP,因为ggplot默认按升序构建级别。您的评论将我引向以下解决方案(标记为#comments的更改):
subj_18mos_resp <- swimplot_response %>%
  group_by(SUBJECT) %>%
  filter(MAX_RESP >= 18) %>%
  arrange(MAX_RESP) #Changed from arrange(desc(MAX_RESP))

subj_18mos_resp

subj_18mos <- unique(subj_18mos_resp$SUBJECT)

subj_18mos_resp$SUBJECT <- factor(subj_18mos_resp$SUBJECT, levels = subj_18mos)
#Re-specified levels from the unique vector produced when arranged by increasing MAX_RESP

subj_18mos_bev <- swimplot_bev %>%
  subset(SUBJECT %in% subj_18mos) %>%
        group_by(SUBJECT) %>%
        arrange(ORD, .by_group = TRUE)

subj_18mos_steroids <- swimplot_steroids %>%
  subset(SUBJECT %in% subj_18mos) %>%
        group_by(SUBJECT) %>%
        arrange(ORD, .by_group = TRUE)

subj_18mos_dose <- swimplot_dose %>%
  subset(SUBJECT %in% subj_18mos) %>%
        group_by(SUBJECT)
页面原文内容由Stack Overflow提供。腾讯云小微IT领域专用引擎提供翻译支持
原文链接:
https://stackoverflow.com/questions/66179334
复制相关文章
相似问题
腾讯云开发者

Copyright © 2013 - 2026 Tencent Cloud. All Rights Reserved. 腾讯云 版权所有
深圳市腾讯计算机系统有限公司 ICP备案/许可证号:粤B2-20090059 ![]() 粤公网安备44030502008569号
粤公网安备44030502008569号
腾讯云计算(北京)有限责任公司 京ICP证150476号 | 京ICP备11018762号