
使用TabPy的Word云
我想在TabPy中创建一些代码来计算列中单词的频率,并删除Tableau中单词云的停止词。
我可以很容易地在Python中做到这一点:
other1_count = other1.answer.str.split(expand=True).stack().value_counts()
other1_count = other1_count.to_frame().reset_index()
other1_count.columns = ['Word', 'Count']

### Remove stopwords
other1_count['Word'] = other1_count['Word'].apply(lambda x: ' '.join([word for word in x.split() if word not in (stop)]))
other1_count['Word'].replace('', np.nan, inplace=True)
other1_count.dropna(subset=['Word'], inplace=True)
other1_count = other1_count[~other1_count.Word.str.contains("nan")]
但不太确定如何在TabPy中运行。任何熟悉TabPy的人,以及我如何才能做到这一点?
提前谢谢。
回答 2
Stack Overflow用户
发布于 2021-03-03 00:00:52
我在R中完成了一个类似的项目,这是一个视频例子,展示了概念的证明(没有音频)。https://www.screencast.com/t/xa0yemiDPl
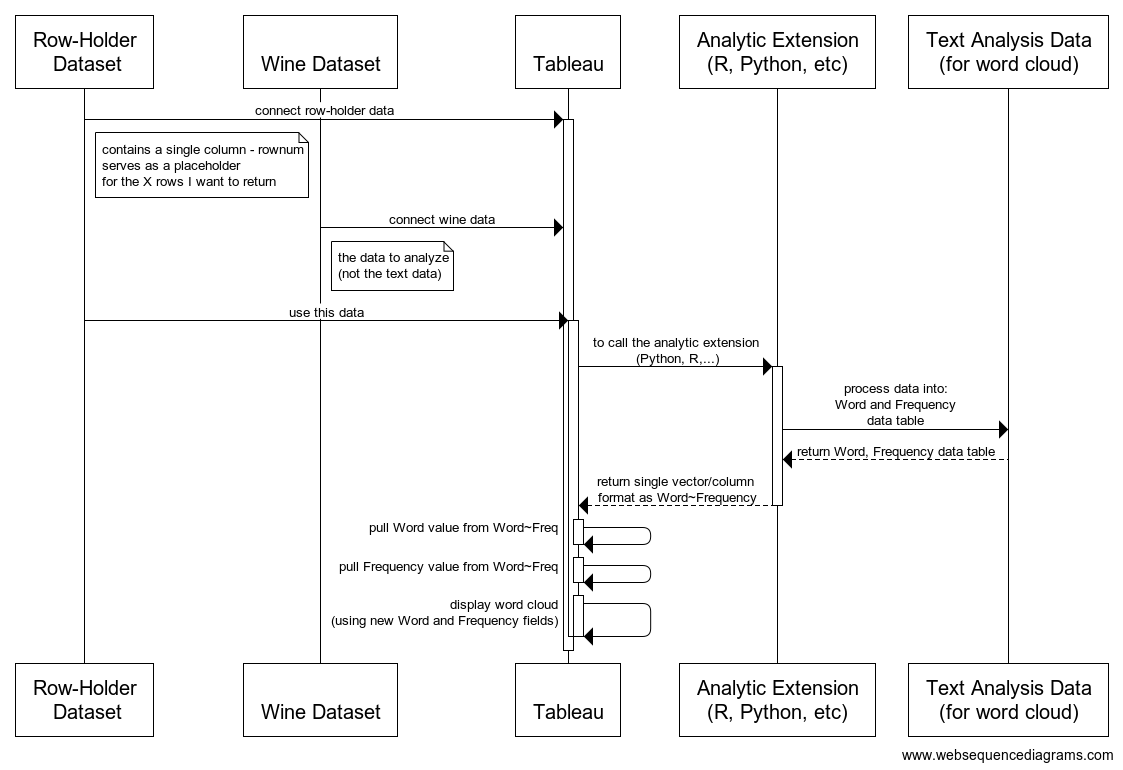
它从本质上显示了使用Tableau对选定国家的单词云中葡萄酒描述进行交互检查的结束状态。主要内容如下:
- 将Tableau连接到要分析的数据,以及占位符数据集,该数据集包含您希望从Python/R代码中获得的记录数量( Tableau对Python/R的调用将返回它发送给处理的相同数量的记录.如果您发送文本数据,但是处理它以返回更多的记录(就像单词云示例中的情况一样),Fields
- leverage /R代码会连接到您的数据,并在单个向量中返回单词和频率计数,这可能会有问题。
- 用分隔符( Tableau对单词云所需的)分隔单个向量,使用Tableau计算的
参数操作来选择要传递给Python/R代码的参数值。
高级概述
Tableau计算场-R Words+Freq
Script_Str('
print("STARTING NEW SCRIPT RUN")
print(Sys.time())
print(.arg2) # grouping
print(.arg1) # selected country


# TEST VARIABLE (non-prod)
.MaxSourceDataRecords = 1000 # -1 to disable

# TABLEAU PARAMETER VARIABLES
.country = "' + [Country Parameter] + '"
.wordsToReturn = ' + str([Return Top N Words]) + '
#^^^^^^^^^^^^^^^^^^^^^^^^^^^^^^^^^^^^^^^^^^^^^^^^^^^#

# VARIABLES DERIVED FROM TABLEAU PARAMETER VALUES
.countryUseAll = (.country == "All")
print(.countryUseAll)
#^^^^^^^^^^^^^^^^^^^^^^^^^^^^^^^^^^^^^^^^^^^^^^^^^^^#

#setwd("C:/Users/jbelliveau/....FILL IN HERE...")
.fileIn = ' + [Source Data Path] + '
#.fileOut = "winemag-with-DTM.csv"

#install.packages("wordcloud")
#install.packages("RColorBrewer") # not needed if installed wordcloud package

library(tm)
library(wordcloud)
library(RColorBrewer) # color package (maps or wordclouds)

wineAll = read.csv(.fileIn, stringsAsFactors=FALSE)

# TODO separately... polarity

# use all the data or just the parameter selected
print(.countryUseAll)

if ( .countryUseAll ) {
  wine = wineAll # filter down to parameter passed from Tableau
}else{
  wine = wineAll[c(wineAll$country == .country),] # filter down to parameter passed from Tableau
}

# limited data for speed (NOT FOR PRODUCTION)
if( .MaxSourceDataRecords > 0 ){
  print("limiting the number of records to use from input data")
  wine = head(wine, .MaxSourceDataRecords)
}


corpus = Corpus(VectorSource(wine$description))
corpus = tm_map(corpus, tolower)
#corpus = tm_map(corpus, PlainTextDocument) # https://stackoverflow.com/questions/32523544/how-to-remove-error-in-term-document-matrix-in-r/36161902
corpus = tm_map(corpus, removePunctuation)
corpus = tm_map(corpus, removeWords, stopwords("English"))
#length(corpus)

dtm = DocumentTermMatrix(corpus)

#?sample
mysample = dtm # no sampling (used Head on data read... for speed/simplicity on this example)
#mysample <- dtm[sample(1:nrow(dtm), 5000, replace=FALSE),]
#nrow(mysample)
wineSample = as.data.frame(as.matrix(mysample))

# column names (the words)
# use colnames to get a vector of the words
#colnames(wineSample)

# freq of words
# colSums to get the frequency of the words
#wineWordFreq = colSums(wineSample)

# structure in a way Tableau will like it
wordCloudData = data.frame(words=colnames(wineSample), freq=colSums(wineSample))
str(wordCloudData)

# sort by word freq
wordCloudDataSorted = wordCloudData[order(-wordCloudData$freq),]

# join together by ~ for processing once Tableau gets it
wordAndFreq = paste(wordCloudDataSorted[, 1], wordCloudDataSorted[, 2], sep = "~")

#write.table(wordCloudData, .fileOut, sep=",",row.names=FALSE) # if needed for performance refactors

topWords = head(wordAndFreq, .wordsToReturn)
#print(topWords)

return( topWords )

',
Max([Country Parameter])
, MAX([RowNum]) // for testing the grouping being sent to R
)单词值:Tableau计算字段:
// grab the first token to the left of ~
Left([R Words+Freq], Find([R Words+Freq],"~") - 1)频率值:Tableau计算字段:
INT(REPLACE([R Words+Freq],[Word]+"~",""))如果你不熟悉Tableau,你可能想和你公司的Tableau分析师一起工作。它们将能够帮助您创建计算的字段,并配置Tableau连接到TabPy。
Stack Overflow用户
发布于 2021-03-02 16:05:45
我认为熟悉与Tableau相关的Python的最好方法可能是Tableau社区上的这个(旧的)线程:
它将逐步解释初始设置以及如何通过Tableau计算字段“调用”Python。
此外,您还可以在文章的顶部找到对更新后的TabPy GitHub存储库的引用:https://github.com/tableau/TabPy
https://stackoverflow.com/questions/66403753
复制相似问题
腾讯云开发者

Copyright © 2013 - 2026 Tencent Cloud. All Rights Reserved. 腾讯云 版权所有
深圳市腾讯计算机系统有限公司 ICP备案/许可证号:粤B2-20090059 ![]() 粤公网安备44030502008569号
粤公网安备44030502008569号
腾讯云计算(北京)有限责任公司 京ICP证150476号 | 京ICP备11018762号