
叠条形图相交
叠条形图相交
提问于 2021-03-12 12:33:31
我有下面的堆栈条形图代码
cols = ['Bug Prediction','Traceability','Security', 'Program Generation & Repair',
'Performance Prediction','Code Similarity & Clone Detection',
'Code Navigation & Understanding', 'Other_SE']
count_ANN = [2.0,0.0,1.0,0.0,0.0,3.0,5.0,1.0]
count_CNN = [1.0,0.0,5.0,0.0,1.0,4.0,4.0,0.0]
count_RNN = [1.0,0.0,3.0,1.0,0.0,4.0,7.0,2.0]
count_LSTM =[3.0,0.0,5.0,3.0,1.0,9.0,15.0,1.0]
count_GNN = [0.0,0.0,1.0,0.0,0.0,3.0,3.0,3.0]
count_AE = [0.0,0.0,1.0,3.0,0.0,6.0,11.0,0.0]
count_AM = [2.0,0.0,1.0,4.0,1.0,4.0,15.0,1.0]
count_other =[1.0,0.0,2.0,2.0,0.0,1.0,3.0,0.0]
b_RNN = list(np.add(count_ANN,count_CNN))
b_LSTM = list(np.add(np.add(count_ANN,count_CNN),count_RNN))
b_AE = list(np.add(np.add(np.add(count_ANN,count_CNN),count_RNN),count_AE))
b_GNN = list(np.add(b_AE,count_GNN))
b_others = list(np.add(b_GNN,count_other))
plt.bar(cols,count_ANN,0.4,label = "ANN")
plt.bar(cols,count_CNN,0.4,bottom=count_ANN,label = "CNN")
plt.bar(cols,count_RNN,0.4,bottom=b_RNN,label = "RNN")
plt.bar(cols,count_LSTM,0.4,bottom =b_LSTM, label = "LSTM")
plt.bar(cols,count_AE,0.4,bottom=b_AE,label = "Auto-Encoder")
plt.bar(cols,count_GNN,0.4,bottom=b_GNN,label = "GNN")
plt.bar(cols,count_other,0.4,bottom=b_others,label = "Others")
#ax.bar(cols, count)
plt.xticks(np.arange(len(cols))+0.1,cols)
fig.autofmt_xdate()
plt.legend()
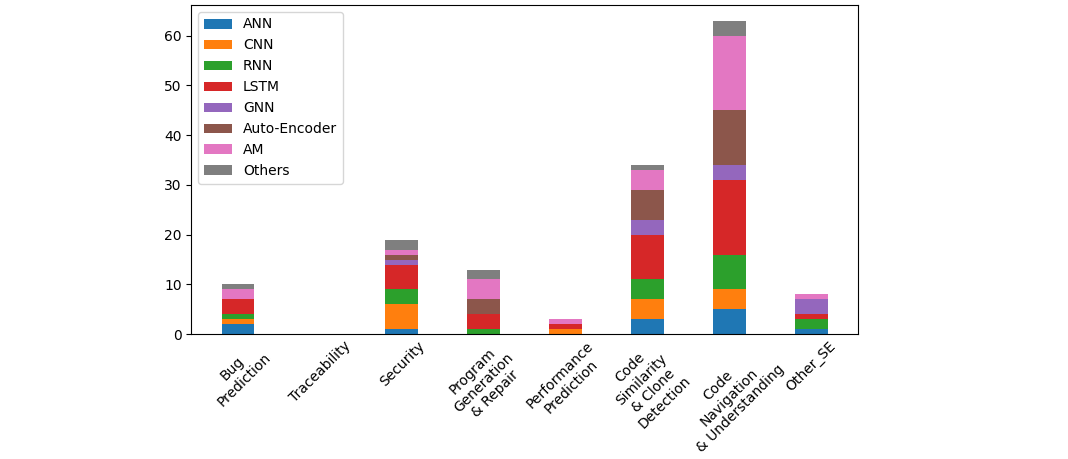
plt.show()然后,输出是重叠的堆栈,如下图所示

回答 1
Stack Overflow用户
回答已采纳
发布于 2021-03-12 18:10:44
具体的问题是b_AE计算错误。(此外,还有一个名为count_AM的列表,没有标签)。
更普遍的问题是,“用手”计算所有这些值很容易出错,而且在发生变化时很难适应。在循环中写东西很有帮助。
numpy的广播与矢量化的魔力使您可以将bottom初始化为单个零,然后使用numpy的加法来添加计数。
为了使x轴更加整洁,您可以将单个单词放在单独的行上。另外,plt.tight_layout()试图确保所有文本都与情节很好地吻合。
import matplotlib.pyplot as plt
import numpy as np

cols = ['Bug Prediction', 'Traceability', 'Security', 'Program Generation & Repair',
        'Performance Prediction', 'Code Similarity & Clone Detection',
        'Code Navigation & Understanding', 'Other_SE']
count_ANN = [2.0, 0.0, 1.0, 0.0, 0.0, 3.0, 5.0, 1.0]
count_CNN = [1.0, 0.0, 5.0, 0.0, 1.0, 4.0, 4.0, 0.0]
count_RNN = [1.0, 0.0, 3.0, 1.0, 0.0, 4.0, 7.0, 2.0]
count_LSTM = [3.0, 0.0, 5.0, 3.0, 1.0, 9.0, 15.0, 1.0]
count_GNN = [0.0, 0.0, 1.0, 0.0, 0.0, 3.0, 3.0, 3.0]
count_AE = [0.0, 0.0, 1.0, 3.0, 0.0, 6.0, 11.0, 0.0]
count_AM = [2.0, 0.0, 1.0, 4.0, 1.0, 4.0, 15.0, 1.0]
count_other = [1.0, 0.0, 2.0, 2.0, 0.0, 1.0, 3.0, 0.0]

all_counts = [count_ANN, count_CNN, count_RNN, count_LSTM, count_GNN, count_AE, count_AM, count_other]
all_labels = ["ANN", "CNN", "RNN", "LSTM", "GNN", "Auto-Encoder", "AM", "Others"]

cols = ["\n".join(c.split(" ")) for c in cols]
cols = [c.replace("&\n", "& ") for c in cols]

bottom = 0
for count_i, label in zip(all_counts, all_labels):
    plt.bar(cols, count_i, 0.4, bottom=bottom, label=label)
    bottom += np.array(count_i)

# plt.xticks(np.arange(len(cols)) + 0.1, cols)
plt.tick_params(axis='x', labelrotation=45, length=0)
plt.legend()
plt.tight_layout()
plt.show()
PS:若要使条形图与图例的顺序相同,您可以从顶部开始画:
bottom = np.sum(all_counts, axis=0)
for count_i, label in zip(all_counts, all_labels):
    bottom -= np.array(count_i)
plt.bar(cols, count_i, 0.4, bottom=bottom, label=label)页面原文内容由Stack Overflow提供。腾讯云小微IT领域专用引擎提供翻译支持
原文链接:
https://stackoverflow.com/questions/66600017
复制相关文章
相似问题
腾讯云开发者

Copyright © 2013 - 2026 Tencent Cloud. All Rights Reserved. 腾讯云 版权所有
深圳市腾讯计算机系统有限公司 ICP备案/许可证号:粤B2-20090059 ![]() 粤公网安备44030502008569号
粤公网安备44030502008569号
腾讯云计算(北京)有限责任公司 京ICP证150476号 | 京ICP备11018762号