
在semPaths中可以更改箭头的长度/位置吗?
在semPaths中可以更改箭头的长度/位置吗?
提问于 2021-03-14 04:08:44
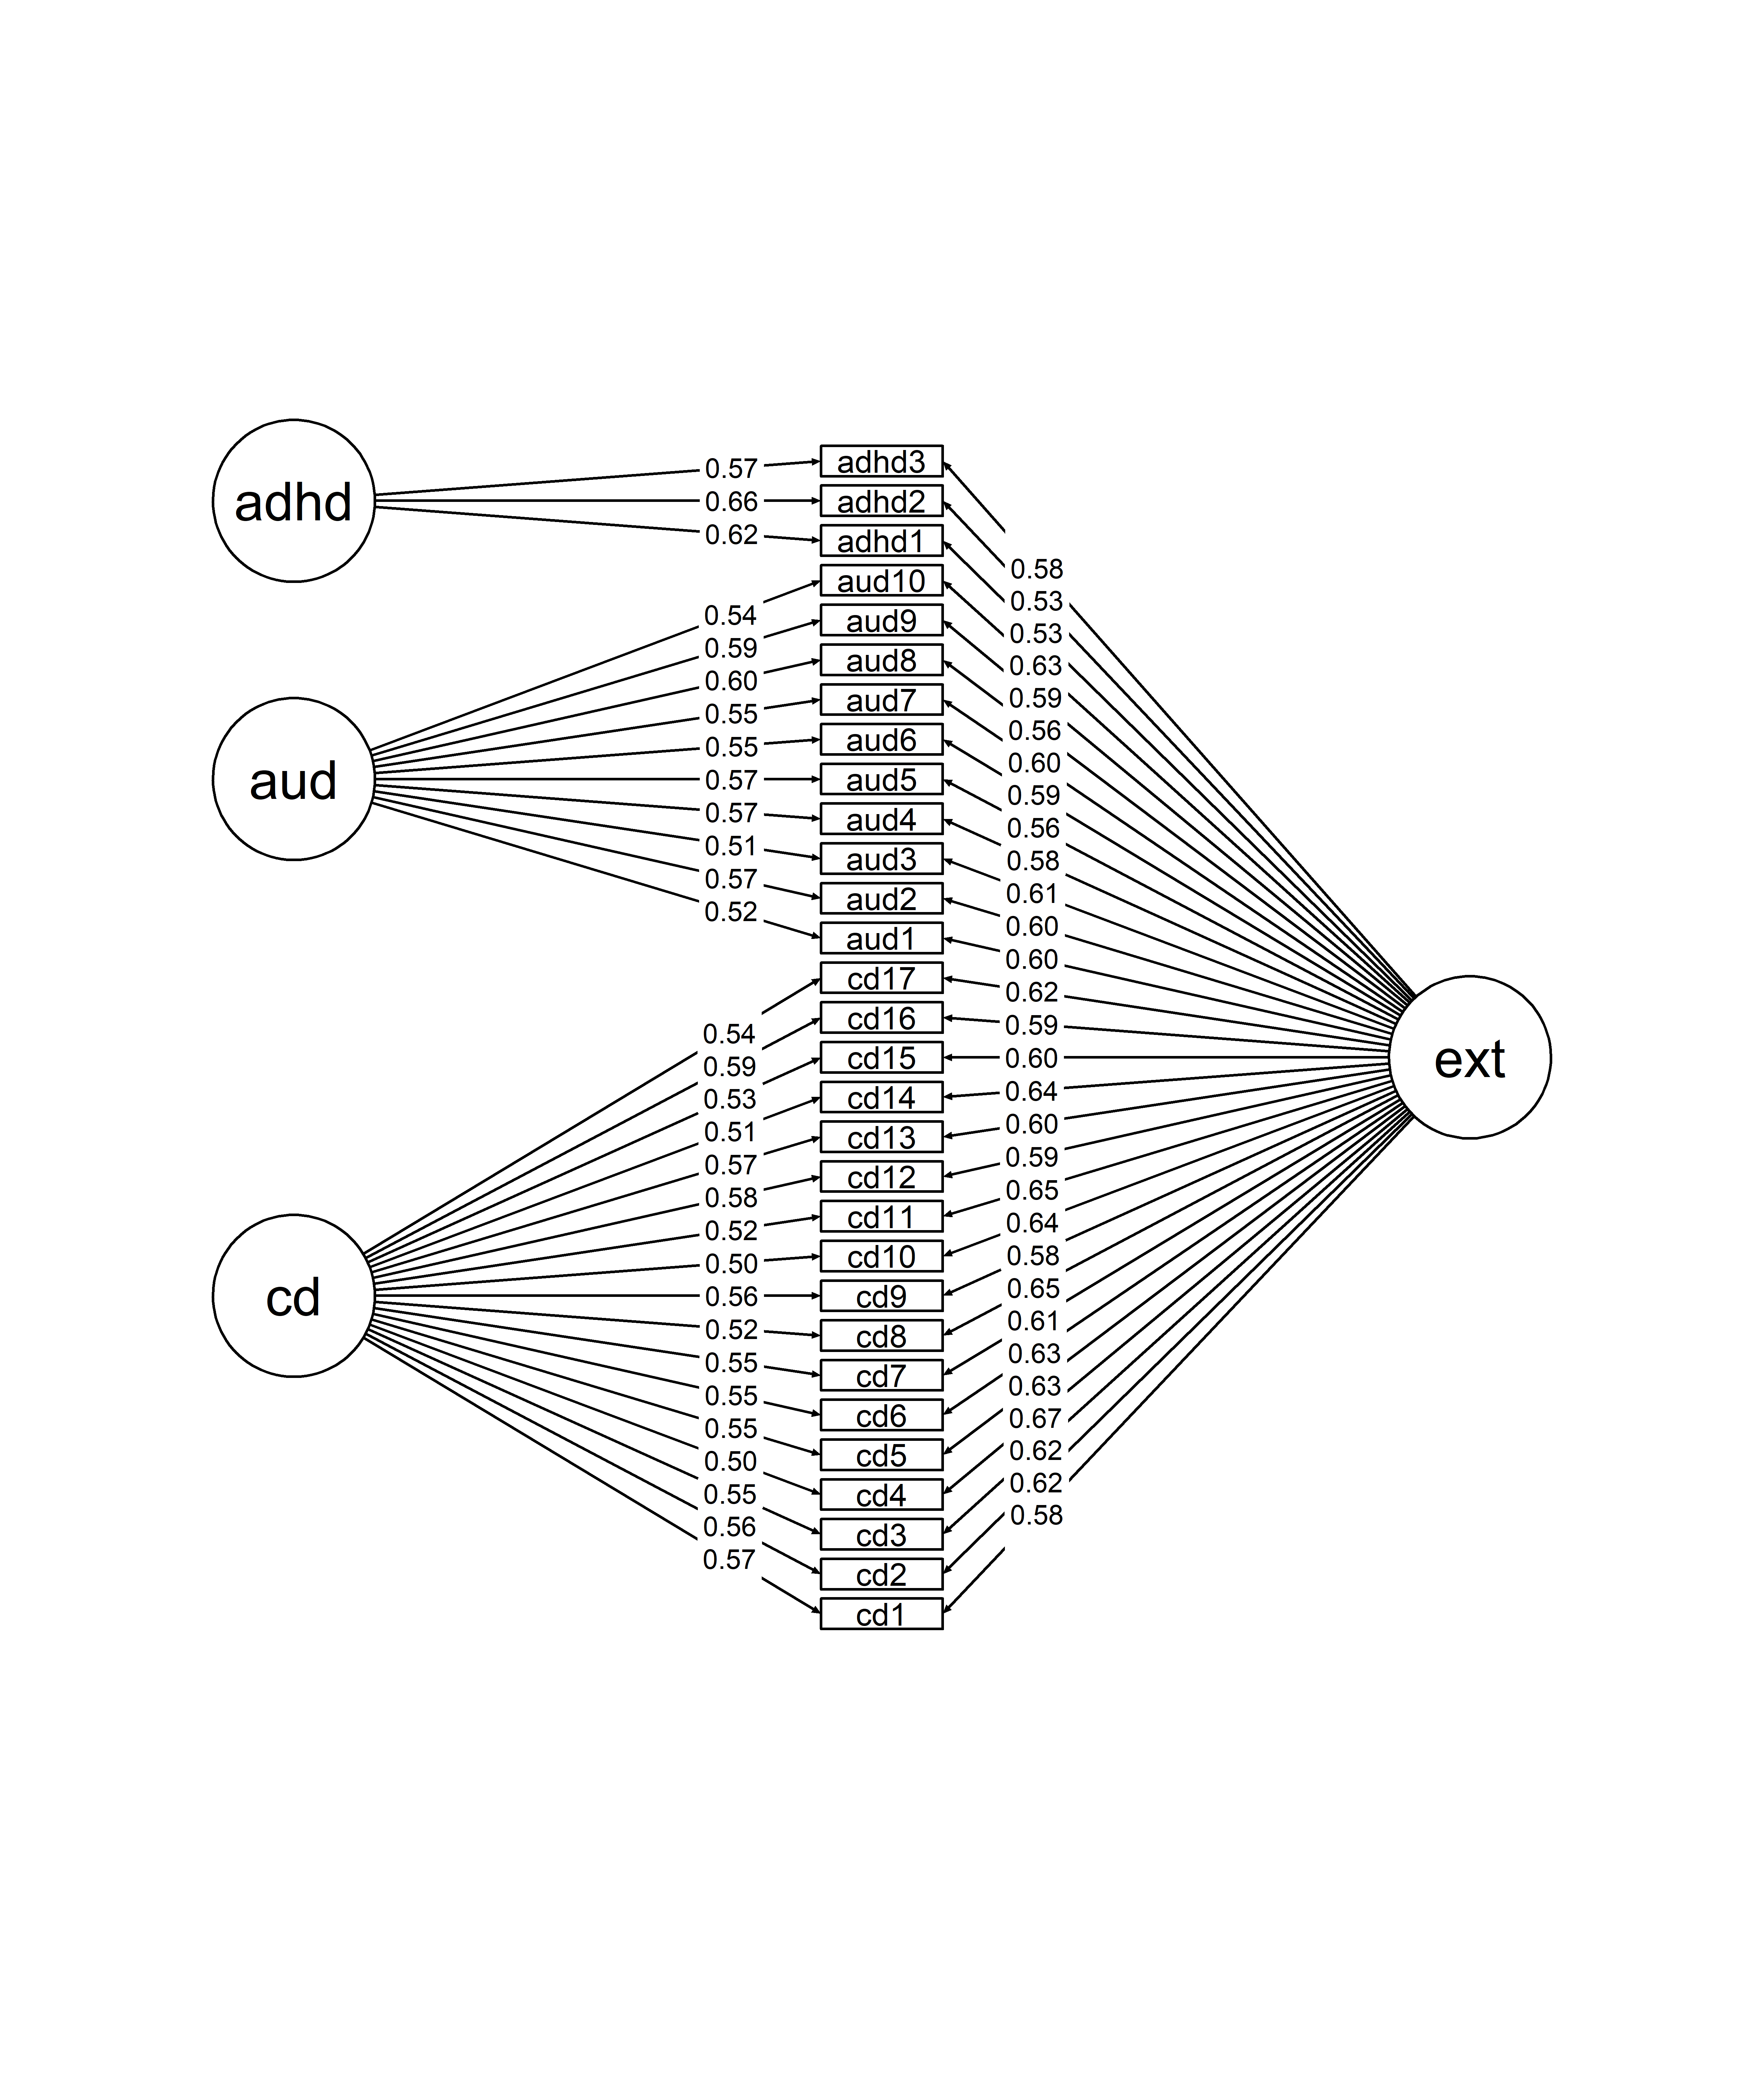
我正在尝试使用semPlot::semPath来绘制我在lavaan中运行的一个双因素模型的一个图。semPlot和q图的文档非常好,所以我已经能够找到我想要的大多数规范,但是有一件事我不确定是可以修复的。正如您在下面的图中所看到的,当潜在因素(例如"ext")连接到范围广泛的显式变量时,很难跟踪哪些箭头/标签与哪个显式变量相关联。(例如,很难说adhd3的ext加载是.23。)看起来,箭头试图连接到清单变量标签的中心,而不是最近的一侧。有什么方法可以改变这一点吗?这样就更容易阅读了?非常感谢!

下面是我使用的代码(抱歉,它太笨重了- 1),我对此和第2条都很陌生。潜在变量会自动出现在奇怪的地方,所以我手动定义了它们的位置):
full_bif_mod <- "ext =~ cd1 + cd2 + cd3 + cd4 + cd5 + cd6 + cd7 + cd8 + cd9 + cd10 + cd11 + cd12 + cd13 + cd14 + cd15 + cd16 + cd17 + aud1 + aud2 + aud3 + aud4 + aud5 + aud6 + aud7 + aud8 + aud9 + aud10 + adhd1 + adhd2 + adhd3
                cd =~ cd1 + cd2 + cd3 + cd4 + cd5 + cd6 + cd7 + cd8 + cd9 + cd10 + cd11 + cd12 + cd13 + cd14 + cd15 + cd16 + cd17
                aud =~ aud1 + aud2 + aud3 + aud4 + aud5 + aud6 + aud7 + aud8 + aud9 + aud10
                adhd =~ adhd1 + adhd2 + adhd3
                ext ~~ 0*adhd
                ext ~~ 0*cd
                ext ~~ 0*aud
                adhd ~~ 0*cd
                adhd ~~ 0*aud
                cd ~~ 0*aud
                  "
summary((full_bifactor <- cfa(full_bif_mod, std.lv=TRUE, data=dat)),fit.measures=TRUE, standardized = T)


x=c(1,2,3,4,5,6,7,8,9,10,11,12,13,14,15,16,17,18,19,20,21,22,23,24,25,26,27,28,29,30, 15, 9, 22, 29)
y=c(0,0,0,0,0,0,0,0,0,0,0,0,0,0,0,0,0,0,0,0,0,0,0,0,0,0,0,0,0,0,1,-1,-1,-1)
ly=matrix(c(y,x), ncol=2)
semPaths(full_bifactor, layout=ly, whatLabels="std", style="lisrel", nCharNodes=5, exoCov=FALSE, residuals=FALSE, label.scale=TRUE, sizeMan2=1.5, sizeMan=6,  asize=1, edge.color="black", edge.label.color="black", edge.label.position=.8, edge.label.margin=-.1, width=17, height=20, filetype="png",filename="cfa"
)回答 1
Stack Overflow用户
回答已采纳
发布于 2021-03-16 09:27:07
这可以通过使用q图中的边缘连接点来完成!见下文:
# Save plot to object:
Plot <- semPaths(full_bifactor, layout=ly,
         whatLabels="std", style="lisrel", nCharNodes=5,
         exoCov=FALSE, residuals=FALSE, label.scale=TRUE,
         sizeMan2=1.5, sizeMan=6,  asize=1, edge.color="black",
         edge.label.color="black", edge.label.position=.8, edge.label.margin=-.1,
         width=17, height=20, filetype="png",filename="cfa"
)

# Add edge connect point to end point of edges (2nd column) for bifactor:
Plot$graphAttributes$Edges$edgeConnectPoints[1:30,2] <- 0.5 * pi

# Add edge connect point to end point of edges (2nd column) for other factors:
Plot$graphAttributes$Edges$edgeConnectPoints[31:60,2] <- 1.5 * pi


# Plot again:
library("qgraph")
plot(Plot)
通过模拟数据:
页面原文内容由Stack Overflow提供。腾讯云小微IT领域专用引擎提供翻译支持
原文链接:
https://stackoverflow.com/questions/66621007
复制相关文章
相似问题
腾讯云开发者

Copyright © 2013 - 2026 Tencent Cloud. All Rights Reserved. 腾讯云 版权所有
深圳市腾讯计算机系统有限公司 ICP备案/许可证号:粤B2-20090059 ![]() 粤公网安备44030502008569号
粤公网安备44030502008569号
腾讯云计算(北京)有限责任公司 京ICP证150476号 | 京ICP备11018762号