
用Python制作一个高级图表
我正在使用一个新的Python框架,称为justpy,它允许您只使用Python构建web应用程序的后端和前端。该框架还与javascript高级图表库集成。下面是如何构建一个包含高图集的web应用程序:
import justpy as jp
import pandas as pd
wm = pd.read_csv('https://elimintz.github.io/women_majors.csv').round(2)
# Create list of majors which start under 20% women students
wm_under_20 = list(wm.loc[0, wm.loc[0] < 20].index)
def women_majors():
wp = jp.WebPage()
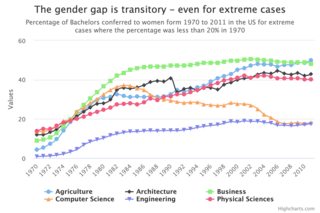
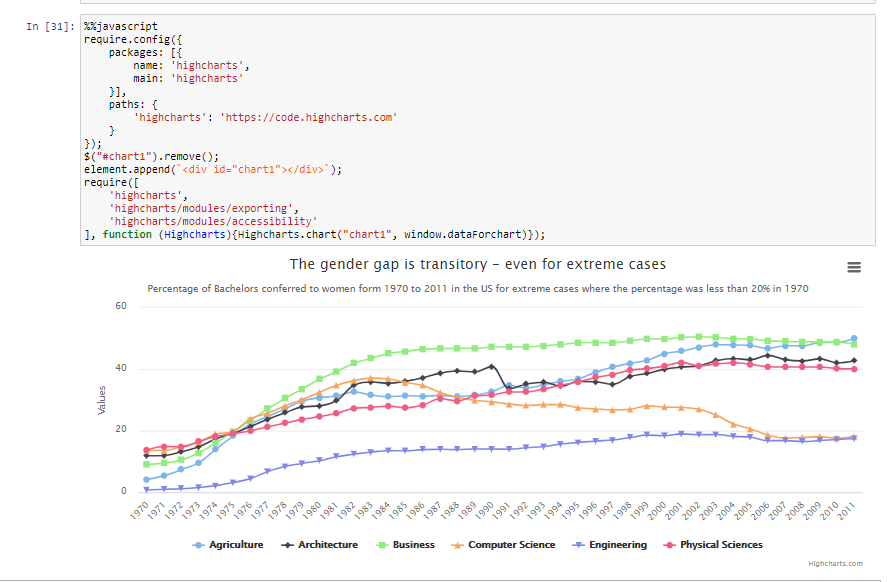
wm.jp.plot(0, wm_under_20, kind='spline', a=wp, title='The gender gap is transitory - even for extreme cases',
subtitle='Percentage of Bachelors conferred to women form 1970 to 2011 in the US for extreme cases where the percentage was less than 20% in 1970',
classes='m-2 p-2 w-3/4')
return wp
jp.justpy(women_majors)它将在localhost上加载webapp :8000:
我现在正试图弄清楚如何只显示高海图图,而不必构建一个web应用程序。
如果我将上面的代码修改为:
import justpy as jp
import pandas as pd


wm = pd.read_csv('https://elimintz.github.io/women_majors.csv').round(2)
# Create list of majors which start under 20% women students
wm_under_20 = list(wm.loc[0, wm.loc[0] < 20].index)

fig = wm.jp.plot(0, wm_under_20, kind='spline', title='The gender gap is transitory - even for extreme cases',
               subtitle='Percentage of Bachelors conferred to women form 1970 to 2011 in the US for extreme cases where the percentage was less than 20% in 1970',
                classes='m-2 p-2 w-3/4')
print(fig)
它将返回以下输出:
HighCharts(id: 1, vue_type: chart, chart options: {'series': [{'data': [4.23,...我怎样才能在不用构建一个网络应用程序的情况下,从HighCharts对象中生成一个图像文件(或者在木星笔记本中显示其情节)?
回答 2
Stack Overflow用户
发布于 2021-03-24 01:44:38
有两种方法。一个是图像,另一个是交互式图表/黑客。
图像.您需要导入requests、Image和json。justpy生成的fig.options将作为一个有效负载发送到高级图表导出服务器,并返回一个图像。
import requests
from IPython.display import Image
import json

#using the fig output from the justpy.plot extension
#fig = wm.jp.plot(0,  ......

payload = {"async": True,
           "constr": "Chart",
           "infile": fig.options,
           "scale": False,
           "type": "image/png",
           "width": False}

response = requests.post("""https://export.highcharts.com/""" ,json=payload)

Image(url='https://export.highcharts.com/'+response.text)朱庇特笔记本互动/哈基的方式做木星作为互动。我复制了这里的方法,嵌入d3.js
您需要导入2样东西,然后使用%%javascript单元格魔术。这些是必要的,因为高图表的图表需要呈现Javascript。
细胞1
#import needed
IPython.display import Javascript
import json
细胞2
#using the fig output from the justpy.plot extension
#fig = wm.jp.plot(0,  ......

#this converts the dict(addict is actually whats used by justpy) into json
Javascript("""
           window.dataForchart={};
           """.format(json.dumps(fig.options)))
细胞3
它运行呈现图表并显示在笔记本中的javascript代码。
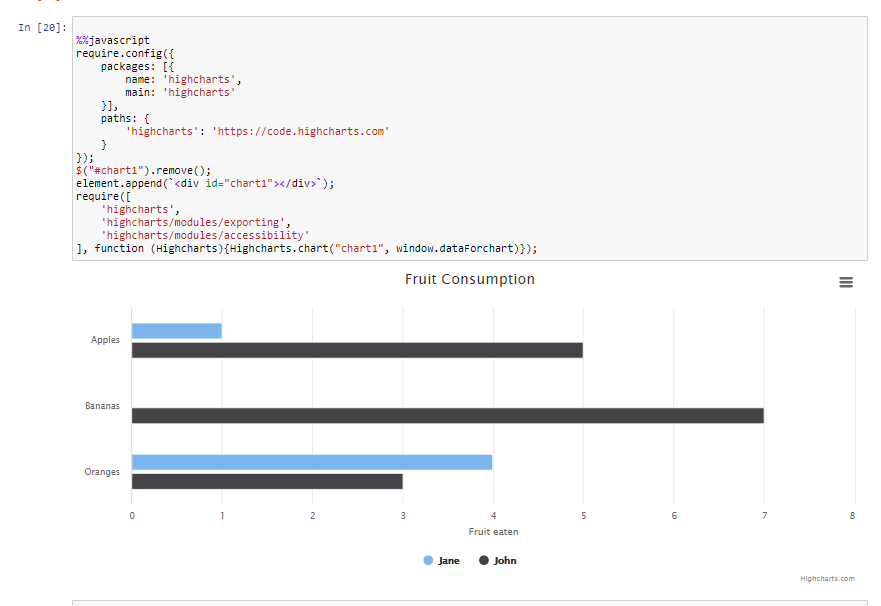
%%javascript
require.config({
    packages: [{
        name: 'highcharts',
        main: 'highcharts'
    }],
    paths: {
        'highcharts': 'https://code.highcharts.com'
    }
});
$("#chart1").remove();
element.append(`<div id="chart1"></div>`);
require([
    'highcharts',
    'highcharts/modules/exporting',
    'highcharts/modules/accessibility'
], function (Highcharts){Highcharts.chart("chart1", window.dataForchart)});
木星实验室互动/哈基
细胞1
from IPython.display import Javascript,HTML
import json
import requests
细胞2
#loads highcharts into the notebook. Succeeding calls for
#Highchart will work if you open this notebook.
response = requests.get('https://code.highcharts.com/highcharts.js')
Javascript(response.text)
细胞3
Javascript("""
           window.dataForchart={};
           """.format(json.dumps(fig.options)))
细胞4
#the HTML function has to be in the last line of the cell
#for this to work. Also this become the output cell
HTML('<div id="chart123"></div>')
细胞5
#make sure that the chart id for the divs you make are unique so they
#dont overwrite each other
Javascript('Highcharts.chart("chart123", window.dataForchart);')下面的图像用于水果图示例
这个是你的具体例子。
Stack Overflow用户
发布于 2021-03-27 15:47:10
他们在高级图表网站上有这样一个问题
https://www.highcharts.com/forum/viewtopic.php?t=32634说
一种选择是使用没有任何服务器的getSVG -导出映像:http://api.highcharts.com/highcharts#Chart.getSVG第二个选项是使用高级图表默认导出服务器- post图表的选项和获取图像:http://www.highcharts.com/docs/export-m .电子概述第三种选择是设置您自己的导出服务器:
http://www.highcharts.com/docs/export-m ...服务器
https://www.highcharts.com/blog/news/52-serverside-generated-charts/
主要代码段:
function(chart) {
    chart.renderer.arc(200, 150, 100, 50, -Math.PI, 0).attr({
        fill : '#FCFFC5',
        stroke : 'black',
        'stroke-width' : 1
     }).add();
}
在堆叠溢出:
这显示了各种方法,并将问题代码调整为
var system = require('system');
var page = require('webpage').create();
var fs = require('fs');

// load JS libraries
page.injectJs("js/jquery.min.js");
page.injectJs("js/highcharts/highcharts.js");
page.injectJs("js/highcharts/exporting.js");

// chart demo
var args = {
width: 600,
height: 500
};

var svg = page.evaluate(function(opt){
$('body').prepend('<div id="container"></div>');

var chart = new Highcharts.Chart({
    chart: {
        renderTo: 'container',
        width: opt.width,
        height: opt.height
    },
    exporting: {
        enabled: false
    },
    title: {
        text: 'Combination chart'
    },
    xAxis: {
        categories: ['Apples', 'Oranges', 'Pears', 'Bananas', 'Plums']
    },
    yAxis: {
        title: {
            text: 'Y-values'
        }
    },
    labels: {
        items: [{
            html: 'Total fruit consumption',
            style: {
                left: '40px',
                top: '8px',
                color: 'black'
            }
        }]
    },
    plotOptions: {
        line: {
            dataLabels: {
                enabled: true
            },
            enableMouseTracking: false
        },
        series: {
            enableMouseTracking: false,
            shadow: false,
            animation: false
        }
    },
    series: [{
        type: 'column',
        name: 'Andrii',
        data: [3, 2, 1, 3, 4]
    }, {
        type: 'column',
        name: 'Fabian',
        data: [2, 3, 5, 7, 6]
    }, {
        type: 'column',
        name: 'Joan',
        data: [4, 3, 3, 9, 0]
    }, {
        type: 'spline',
        name: 'Average',
        data: [3, 2.67, 3, 6.33, 3.33],
        marker: {
            lineWidth: 2,
            lineColor: 'white'
        }
    }, {
        type: 'pie',
        name: 'Total consumption',
        data: [{
            name: 'Andrii',
            y: 13,
            color: '#4572A7'
        }, {
            name: 'Fabian',
            y: 23,
            color: '#AA4643'
        }, {
            name: 'Joan',
            y: 19,
            color: '#89A54E'
        }],
        center: [100, 80],
        size: 100,
        showInLegend: false,
        dataLabels: {
            enabled: false
        }
    }]
});

return chart.getSVG();
},  args);

// Saving SVG to a file
fs.write("demo.svg", svg);
// Saving diagram as PDF
page.render('demo.pdf');

phantom.exit();https://stackoverflow.com/questions/66696549
复制相似问题
腾讯云开发者

Copyright © 2013 - 2026 Tencent Cloud. All Rights Reserved. 腾讯云 版权所有
深圳市腾讯计算机系统有限公司 ICP备案/许可证号:粤B2-20090059 ![]() 粤公网安备44030502008569号
粤公网安备44030502008569号
腾讯云计算(北京)有限责任公司 京ICP证150476号 | 京ICP备11018762号