
离子5中的Chart.js
通过查看本教程( Chart.js ),我一直试图在Ionic 5中使用https://ichi.pro/es/ionic-5-charts-graphs-usando-la-biblioteca-chartjs-102145521332905,但我得到了以下错误:
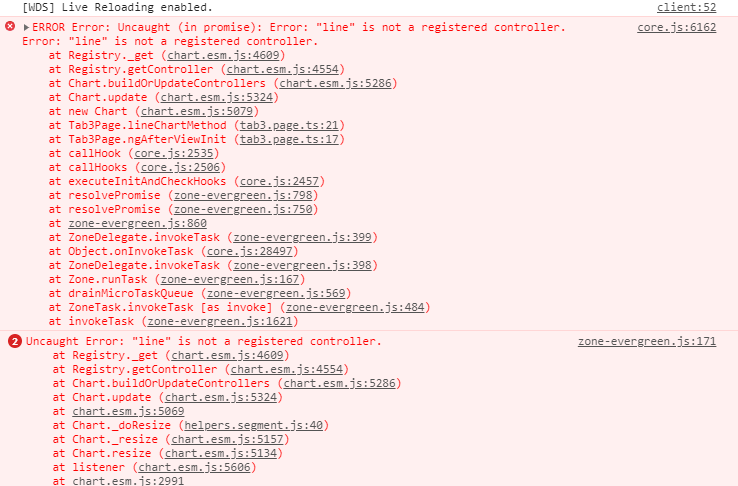
除了文件名之外,代码几乎是相同的。不太明白为什么会发生,任何帮助都是受欢迎的。
import { Component, AfterViewInit, ViewChild , ElementRef } from '@angular/core';
import {Chart} from "chart.js";

@Component({
  selector: 'app-tab3',
  templateUrl: 'tab3.page.html',
  styleUrls: ['tab3.page.scss']
})
export class Tab3Page implements AfterViewInit{
  @ViewChild('lineCanvas') private lineCanvas: ElementRef;

  lineChart: any;

  constructor() { }

  ngAfterViewInit() {
    this.lineChartMethod();
  }

  lineChartMethod() {
    this.lineChart = new Chart(this.lineCanvas.nativeElement, {
      type: 'line',
      data: {
        labels: ['January', 'February', 'March', 'April', 'May', 'June', 'July', 'August', 'September', 'November', 'December'],
        datasets: [
          {
            label: 'Sell per week',
            fill: false,
            //lineTension: 0.1,
            backgroundColor: 'rgba(75,192,192,0.4)',
            borderColor: 'rgba(75,192,192,1)',
            borderCapStyle: 'butt',
            borderDash: [],
            borderDashOffset: 0.0,
            borderJoinStyle: 'miter',
            pointBorderColor: 'rgba(75,192,192,1)',
            pointBackgroundColor: '#fff',
            pointBorderWidth: 1,
            pointHoverRadius: 5,
            pointHoverBackgroundColor: 'rgba(75,192,192,1)',
            pointHoverBorderColor: 'rgba(220,220,220,1)',
            pointHoverBorderWidth: 2,
            pointRadius: 1,
            pointHitRadius: 10,
            data: [65, 59, 80, 81, 56, 55, 40, 10, 5, 50, 10, 15],
            spanGaps: false,
          }
        ]
      }
    });
  }
}
这是HTML
<ion-content [fullscreen]="true">
   <div class="ion-padding">
    <ion-card>
      <ion-card-header>
        Line Chart
      </ion-card-header>
      <ion-card-content>
        <canvas #lineCanvas style="position: relative; height:20vh; width:40vw"></canvas>
      </ion-card-content>
    </ion-card>
  </div>
</ion-content>回答 2
Stack Overflow用户
发布于 2021-04-10 13:19:59
Chart.js需要在加载数据之前注册控制器,但是不管底层机制是什么,下面是chart.js文档中的在类型记录中插入图表的正确方法:
一种简短的注册格式也可用于快速注册所有内容。
从“chart.js”导入{图表、寄存器};Chart.register(...registerables);
最后,有一条单独的路径可以为您完成上述工作,在一行中:
从“图表”导入图表;
来源:https://www.chartjs.org/docs/master/getting-started/integration.html
Stack Overflow用户
发布于 2021-10-17 09:11:25
从“chart.js”导入{图表、寄存器};Chart.register(...registerables);
把这个..。
https://stackoverflow.com/questions/67021385
复制相似问题
腾讯云开发者

Copyright © 2013 - 2026 Tencent Cloud. All Rights Reserved. 腾讯云 版权所有
深圳市腾讯计算机系统有限公司 ICP备案/许可证号:粤B2-20090059  粤公网安备44030502008569号
腾讯云计算(北京)有限责任公司 京ICP证150476号 | 京ICP备11018762号