
打印可挠性对象子组中的汇总统计信息
打印可挠性对象子组中的汇总统计信息
提问于 2021-04-19 07:47:28
上下文:,我正在尝试创建一个按组包含汇总统计信息的docx表。
问题:如何在每个组的顶部或底部添加汇总统计信息(例如sum),并将“总计”行作为最后一行?
到目前为止,我使用flextable::as_grouped_data()获得了很好的结果,如下所示:https://davidgohel.github.io/flextable/reference/as_grouped_data.html#see-also
示例:
library(dplyr) # feel free to use data.table if you prefer, I am just more used to dplyr
data_co2_2 <- CO2 %>%
  group_by(Type, Treatment, conc) %>%
  summarise(uptake = mean(uptake)) %>%
  pivot_wider(names_from = Type, values_from = uptake)

data_co2_2 <- as_grouped_data(x = data_co2_2, groups = c("Treatment"))
输出:
data_co2
#>     Treatment conc   Quebec Mississippi
#> 1  nonchilled   NA       NA          NA
#> 3        <NA>   95 15.26667    11.30000
#> 4        <NA>  175 30.03333    20.20000
#> 5        <NA>  250 37.40000    27.53333
#> 6        <NA>  350 40.36667    29.90000
#> 7        <NA>  500 39.60000    30.60000
#> 8        <NA>  675 41.50000    30.53333
#> 9        <NA> 1000 43.16667    31.60000
#> 2     chilled   NA       NA          NA
#> 10       <NA>   95 12.86667     9.60000
#> 11       <NA>  175 24.13333    14.76667
#> 12       <NA>  250 34.46667    16.10000
#> 13       <NA>  350 35.80000    16.60000
#> 14       <NA>  500 36.66667    16.63333
#> 15       <NA>  675 37.50000    18.26667
#> 16 <NA> 1000 40.83333 18.73333期望输出:在"group“行中,而不是NA,我想显示一个汇总统计数据(比如子组的和)。蛋糕上的糖霜:在桌子底部显示一个“总体总数”。
回答 1
Stack Overflow用户
回答已采纳
发布于 2021-04-19 08:30:02
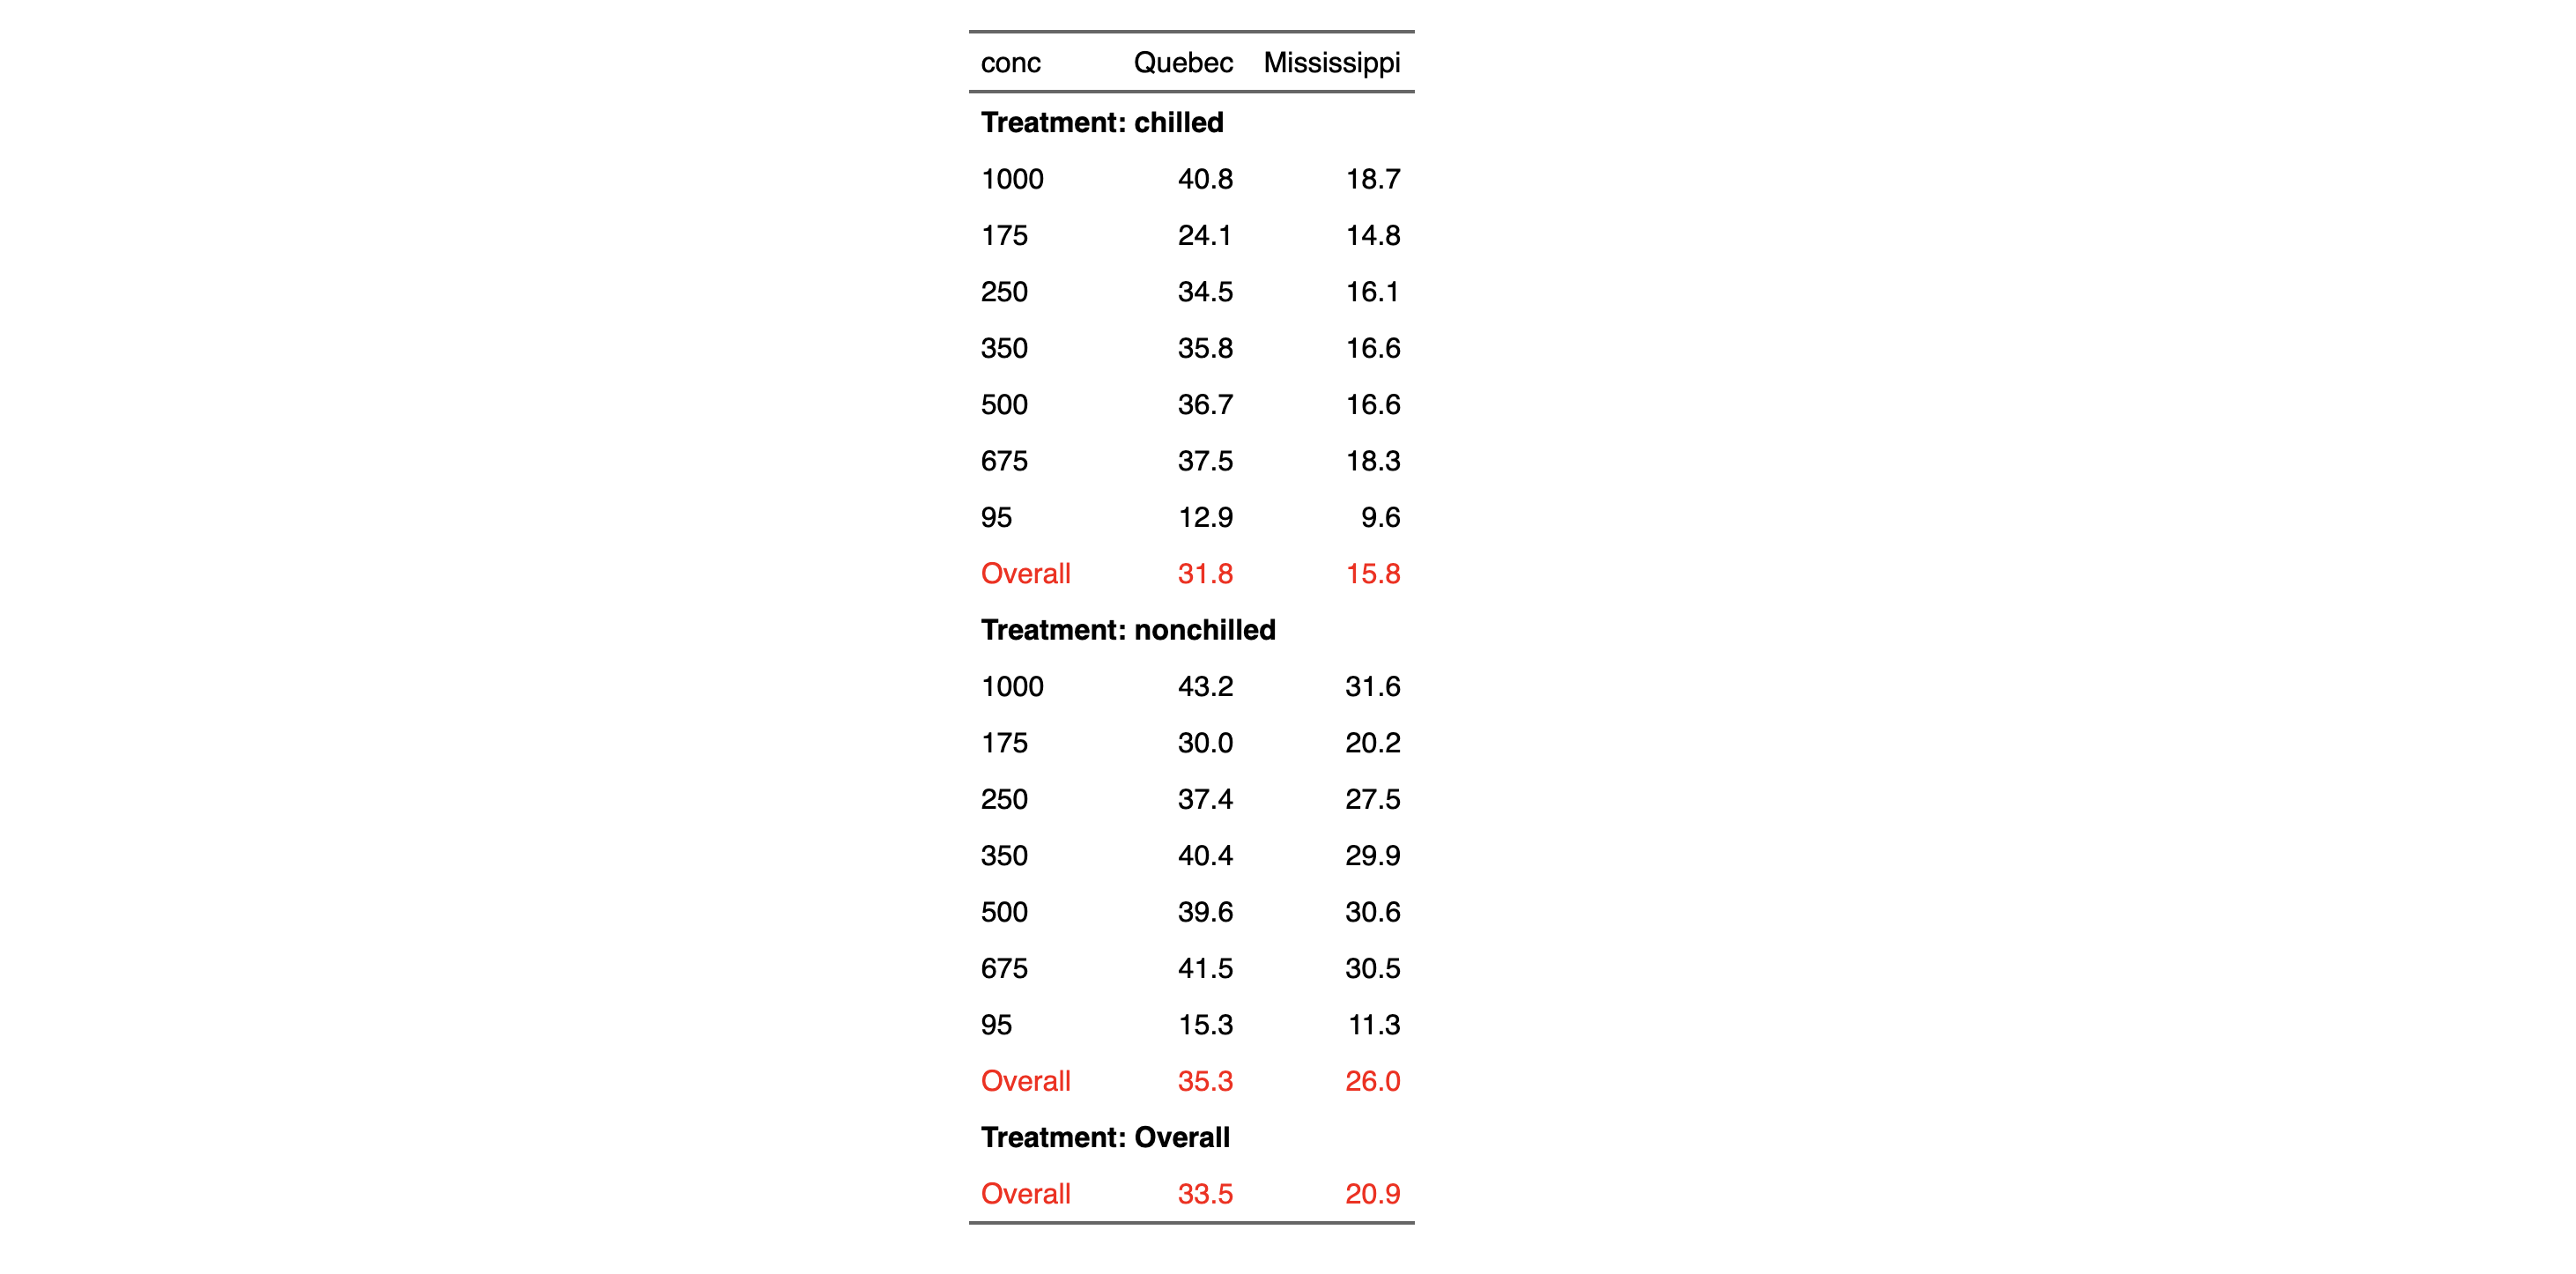
,而不是"group“行中的NA,我想显示一个汇总统计数据(比如子组的和)。
如果使用as_grouped_data() %>% as_flextable(),这是不可能的。显示的值是组的名称。
以下是一项建议:
library(flextable)
library(dplyr)
library(tidyr)

CO2 <- CO2 %>%
  mutate(conc = as.character(conc))

agg1 <- CO2 %>%
  group_by(Type, Treatment, conc) %>%
  summarise(uptake = mean(uptake), .groups = "drop")

agg2 <- CO2 %>%
  group_by(Type, Treatment) %>%
  summarise(uptake = mean(uptake), .groups = "drop") %>%
  mutate(conc="Overall")

agg3 <- CO2 %>%
  group_by(Type) %>%
  summarise(uptake = mean(uptake), .groups = "drop")  %>%
  mutate(conc="Overall", Treatment = "Overall")


all_data <- bind_rows(agg1, agg2, agg3) %>%
  arrange(Type, Treatment, conc) %>%
  pivot_wider(names_from = Type, values_from = uptake)

as_grouped_data(x = all_data, groups = c("Treatment")) %>%
  as_flextable() %>%
  compose(i = ~ is.na(conc) & is.na(Treatment),
          j = "conc", value = as_paragraph("avg for all conc")) %>%
  compose(i = ~ is.na(conc) & is.na(Treatment),
          j = "conc", value = as_paragraph("avg for all conc")) %>%
  bold(bold = TRUE, i = ~!is.na(Treatment)) %>%
  color(i= ~ conc %in% "Overall", color = "red") %>%
  colformat_double(j = c("Quebec", "Mississippi"), digits = 1)
页面原文内容由Stack Overflow提供。腾讯云小微IT领域专用引擎提供翻译支持
原文链接:
https://stackoverflow.com/questions/67157907
复制相关文章
相似问题
腾讯云开发者

Copyright © 2013 - 2026 Tencent Cloud. All Rights Reserved. 腾讯云 版权所有
深圳市腾讯计算机系统有限公司 ICP备案/许可证号:粤B2-20090059  粤公网安备44030502008569号
腾讯云计算(北京)有限责任公司 京ICP证150476号 | 京ICP备11018762号