
如何使y轴上的数字以百万为单位来表示值,而不是以matplotlib中的科学符号表示?
如何使y轴上的数字以百万为单位来表示值,而不是以matplotlib中的科学符号表示?
提问于 2021-04-23 18:47:43
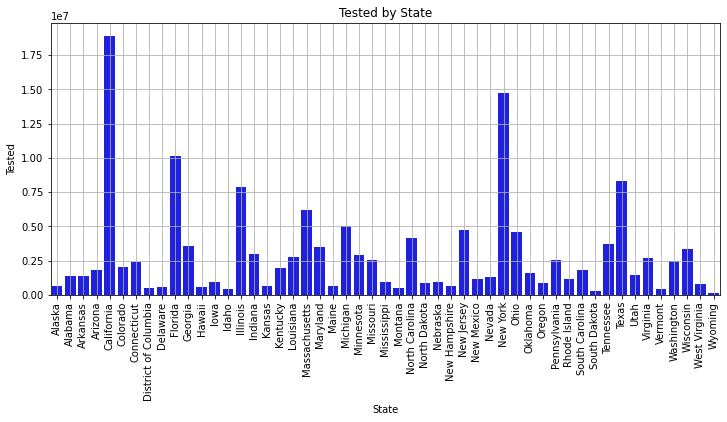
如何将y轴上的数字更改为0到1700万,而不是0到1.751e7?
import numpy as np
import pandas as pd
import matplotlib.pyplot as plt
import seaborn as sns
import pingouin as pg
import plotly
import plotly.express as pxdata = pd.read_csv('COVID19_state.csv')fig, ax = plt.subplots(figsize=(12,5))
ax = sns.barplot(x = 'State', y = 'Tested', data = data, color='blue');
ax.set_title('Tested by State')
ax.set_xticklabels(labels=data['State'], rotation=90)
ax.set_ylabel('Tested')
ax.set_xlabel('State')
plt.grid()
plt.show()输出:
回答 1
Stack Overflow用户
回答已采纳
发布于 2021-04-23 22:04:56
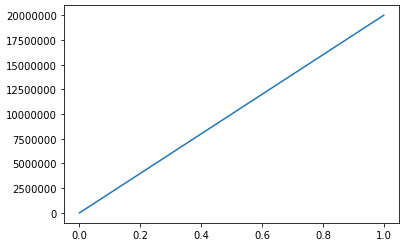
我找到了两个选项,第一个选项获取默认的matplotlib.ticker.ScalarFormatter并关闭科学符号:
fig, ax = plt.subplots()
ax.yaxis.get_major_formatter().set_scientific(False)
ax.yaxis.get_major_formatter().set_useOffset(False)
ax.plot([0, 1], [0, 2e7])
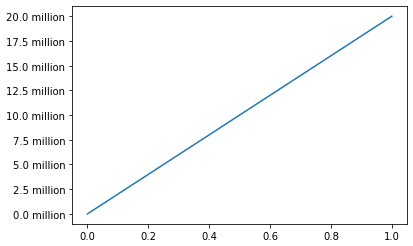
第二个方法定义了一个自定义格式化程序,它除以1e6并附加“百万”:
from matplotlib.ticker import NullFormatter

def formatter(x, pos):
    return str(round(x / 1e6, 1)) + " million"

fig, ax = plt.subplots()
ax.yaxis.set_major_formatter(formatter)
ax.yaxis.set_minor_formatter(NullFormatter())
ax.plot([0, 1], [0, 2e7])
我在ScalarFormatter中找不到一个将1e6替换为“百万”的方法,但我确信matplotlib中有一种方法可以让您在真正需要的情况下做到这一点。
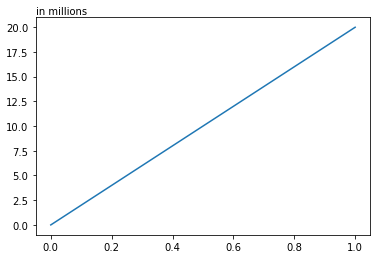
编辑:使用ax.text
from matplotlib.ticker import NullFormatter

def formatter(x, pos):
    return str(round(x / 1e6, 1))

fig, ax = plt.subplots()
ax.yaxis.set_major_formatter(formatter)
ax.yaxis.set_minor_formatter(NullFormatter())
ax.plot([0, 1], [0, 2e7])
ax.text(0, 1.05, "in millions", transform = ax.transAxes, ha = "left", va = "top")
当然,如果你已经有了一个标签,把它包括在那里也许会更有意义,至少我会这样做:
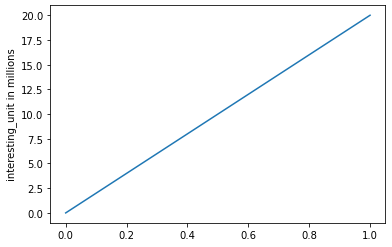
from matplotlib.ticker import NullFormatter

def formatter(x, pos):
    return str(round(x / 1e6, 1))

fig, ax = plt.subplots()
ax.yaxis.set_major_formatter(formatter)
ax.yaxis.set_minor_formatter(NullFormatter())
ax.plot([0, 1], [0, 2e7])
ax.set_ylabel("interesting_unit in millions")
如果您确保您的数据已经以数百万为单位,并且在1e-4和1e5之间(在此范围内为科学表示法会起作用),则可以省略最后两个方法中设置格式化程序的整个部分,只需将ax.text(0, 1.05, "in millions", transform = ax.transAxes, ha = "left", va = "top")或ax.set_ylabel("interesting_unit in millions")添加到代码中即可。您仍然需要为其他两个方法设置格式化程序。
页面原文内容由Stack Overflow提供。腾讯云小微IT领域专用引擎提供翻译支持
原文链接:
https://stackoverflow.com/questions/67235388
复制相关文章
相似问题
腾讯云开发者

Copyright © 2013 - 2026 Tencent Cloud. All Rights Reserved. 腾讯云 版权所有
深圳市腾讯计算机系统有限公司 ICP备案/许可证号:粤B2-20090059 ![]() 粤公网安备44030502008569号
粤公网安备44030502008569号
腾讯云计算(北京)有限责任公司 京ICP证150476号 | 京ICP备11018762号