
地质公园没有绘制正确的颜色
地质公园没有绘制正确的颜色
提问于 2021-05-16 02:55:19
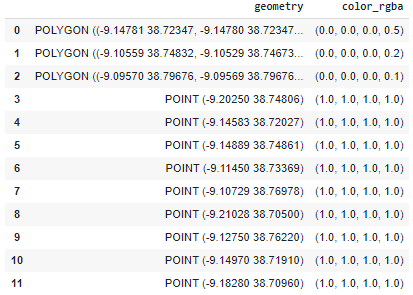
我的Geopandas DataFrame有3个多边形和9个用matplotlib.colors.to_rgba函数计算的color_rgba列的点:
import contextily as ctx
import geopandas as gpd

(...)
rdf[['geometry','color_rgba']]
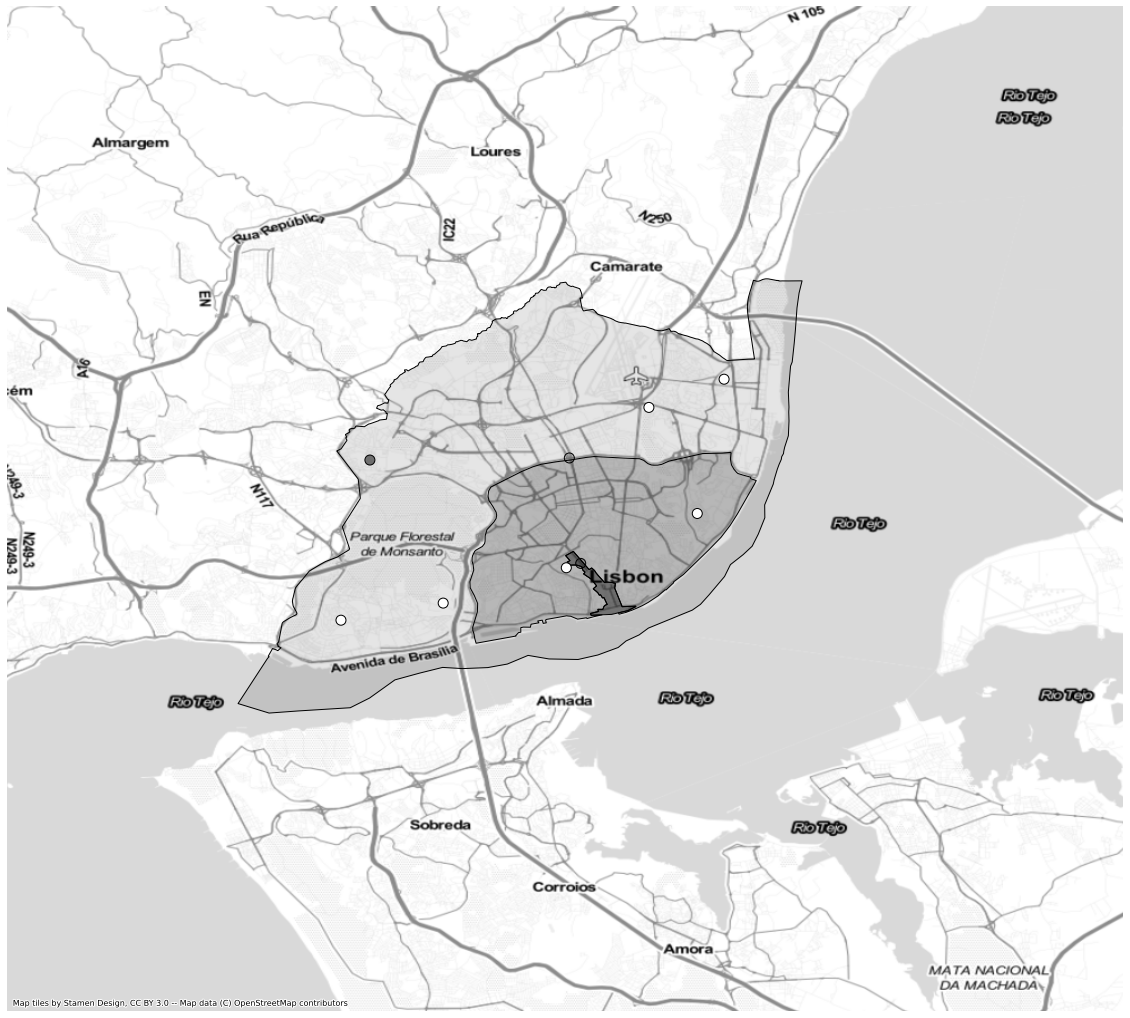
当我试图绘制地图时,9点中的3点发生了一些奇怪的事情:
,
- ,他们继承了多边形的颜色(黑暗),我不明白为什么。
- ,根据
color_rgba列,他们都应该是白色的。
。
代码:
ax = rdf.plot(figsize=(20, 20), markersize = 100, edgecolor='k', color=rdf['color_rgba'])
xlim = ([-9.30, -9.00])
ylim = ([38.60, 38.87])
ax.set_xlim(xlim)
ax.set_ylim(ylim)
ctx.add_basemap(ax, crs=df.crs, url=ctx.providers.Stamen.TonerLite)
ax.set_axis_off()
回答 1
Stack Overflow用户
回答已采纳
发布于 2022-04-23 08:21:21
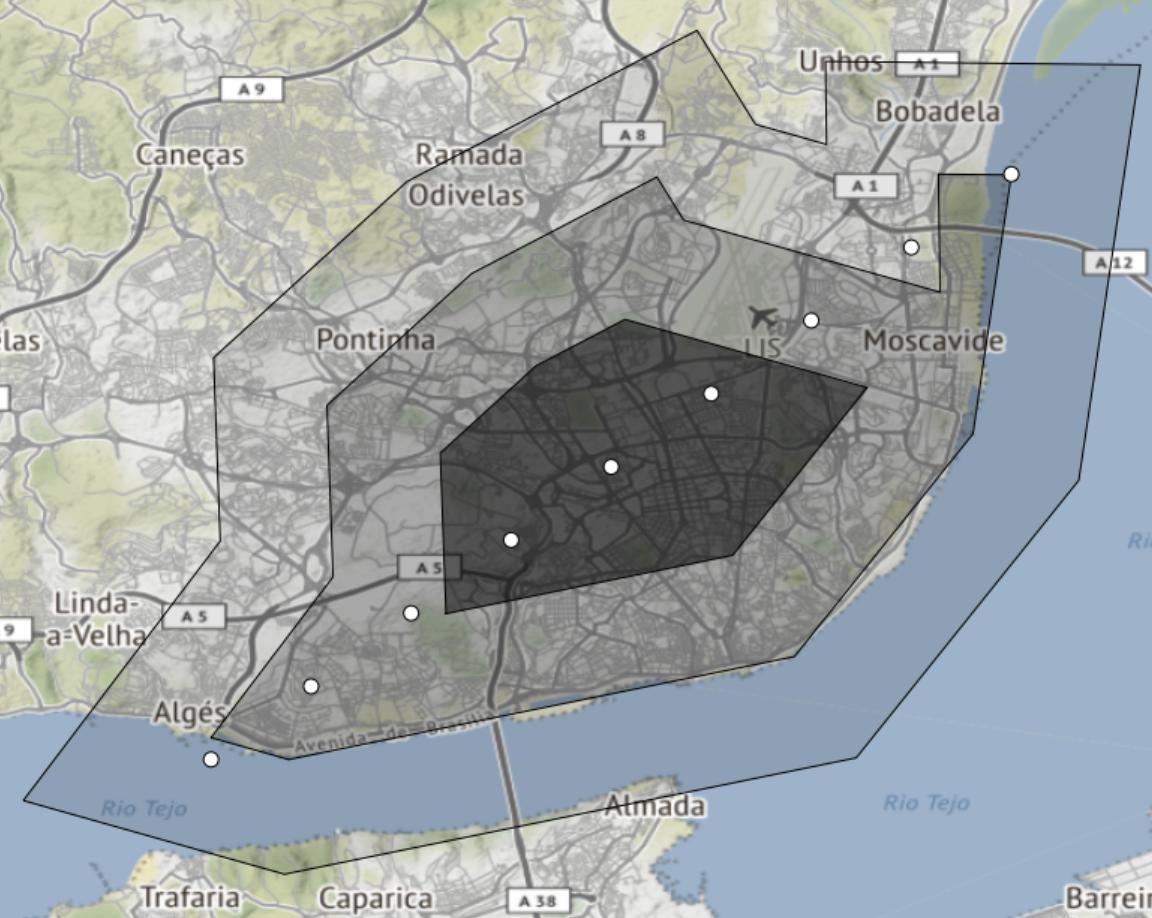
正如@joris所指出的,
- 有一个已知的bug。我打算做一个PR来解决这个问题,所以希望以此作为测试用例,
- 已经创建了类似于您在
- 问题中显示的类似于屏幕快照的几何图形,下面的内容可以用作围绕
的工作
cmap = LinearSegmentedColormap.from_list(
    "seg", rdf["color_rgba"].unique(), N=len(rdf["color_rgba"].unique())
)
ax = rdf.plot(
    figsize=(20, 20), markersize=100, edgecolor="k", column="color_rgba", cmap=cmap
)
全码
import geopandas as gpd
import contextily as ctx
import matplotlib.pyplot as plt
import shapely.wkt, shapely.geometry
import numpy as np
from matplotlib.colors import LinearSegmentedColormap

# reconstruct some geometry as not provided in question
lisbon = "POLYGON ((-9.2298356 38.69532759999999, -9.2159024 38.6913994, -9.1252283 38.70985619999998, -9.0932228 38.74978019999999, -9.0863328 38.79622539999999, -9.0993972 38.79637019999999, -9.0991256 38.7752176, -9.1450919 38.788146499999996, -9.1498877 38.7958538, -9.1831151 38.7785452, -9.2090617 38.7549077, -9.2079549 38.7241641, -9.2298356 38.69532759999999))"
b = np.array(shapely.wkt.loads(lisbon).bounds)
rdf = gpd.GeoDataFrame(
    {
        "geometry": [
            shapely.wkt.loads(lisbon).buffer(0.02, cap_style=2, join_style=2),
            shapely.wkt.loads(lisbon),
            shapely.wkt.loads(lisbon).buffer(-0.02, cap_style=2, join_style=2),
        ]
        + [
            shapely.geometry.Point(xy)
            for xy in zip(np.linspace(*b[[0, 2]], 9), np.linspace(*b[[1, 3]], 9))
        ],
        "color_rgba": [(0.0, 0.0, 0.0, 0.5), (0.0, 0.0, 0.0, 0.2), (0.0, 0.0, 0.0, 0.1)]
        + [(1.0, 1.0, 1.0, 1.0) for _ in range(9)],
    },
    crs="epsg:4386",
)

# ax = rdf.plot(figsize=(20, 20), markersize = 100, edgecolor='k', color=rdf['color_rgba'])
cmap = LinearSegmentedColormap.from_list(
    "seg", rdf["color_rgba"].unique(), N=len(rdf["color_rgba"].unique())
)
ax = rdf.plot(
    figsize=(20, 20), markersize=100, edgecolor="k", column="color_rgba", cmap=cmap
)

xlim = [-9.30, -9.00]
ylim = [38.60, 38.87]
ax.set_xlim(xlim)
ax.set_ylim(ylim)
ctx.add_basemap(ax, crs=rdf.crs, url=ctx.providers.Stamen.TonerLite)
ax.set_axis_off()
页面原文内容由Stack Overflow提供。腾讯云小微IT领域专用引擎提供翻译支持
原文链接:
https://stackoverflow.com/questions/67552817
复制相关文章
相似问题
腾讯云开发者

Copyright © 2013 - 2026 Tencent Cloud. All Rights Reserved. 腾讯云 版权所有
深圳市腾讯计算机系统有限公司 ICP备案/许可证号:粤B2-20090059 ![]() 粤公网安备44030502008569号
粤公网安备44030502008569号
腾讯云计算(北京)有限责任公司 京ICP证150476号 | 京ICP备11018762号