
避免与rworldmap重叠的文本标签
避免与rworldmap重叠的文本标签
提问于 2021-05-17 08:41:10
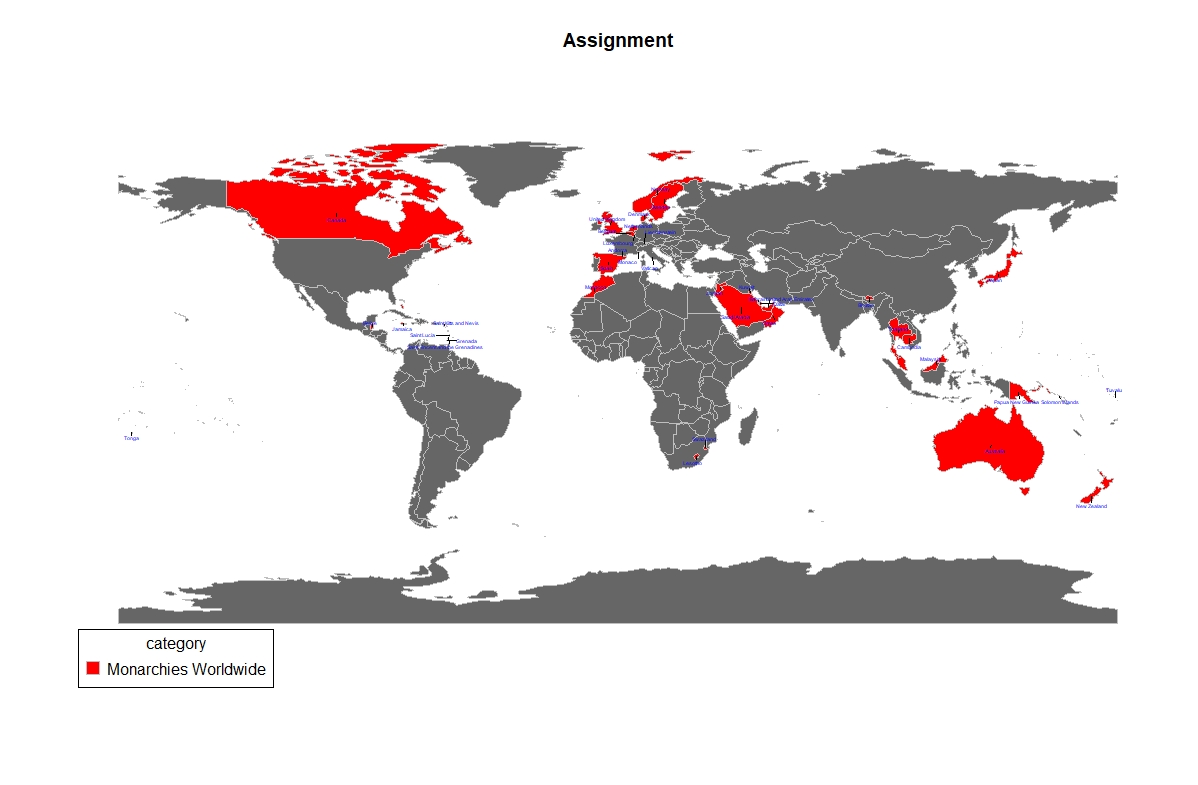
我正在用rworldmap创建一个世界地图,并使用text函数添加国家名称。但是,文本标签重叠。我尝试了adj和pos参数,但到目前为止还没有结果。有小费吗?
library(rworldmap)

DF = data.frame(q = c("VAT","ESP","CAN","AND","MCO","VCT",
                      "NLD", "LUX", "GBR", "LIE", "BEL", "DNK",
                      "SWE","NOR","ATG","AUS", "BHS", "BHR","BRB",
                      "BLZ","BTN","BRN","KHM","CAN","SWZ","GRD",
                      "JAM","JPN","KWT","JOR","LSO","MYS","MAR",
                      "NZL","OMN","PNG","QAT","KNA","LCA","SAU",
                      "SLB","THA","TON","TUV","ARE" ),
                Assignment = ("Monarchies Worldwide"))

country = c("Vatican","Spain","Monaco","Canada","Andorra","Saint Vincent and the Grenadines",
            "Netherlands", "Luxembourg","United Kingdom", "Liechtenstein","Belgium","Denmark",
            "Sweden","Norway","Anitgua and Barbuda","Australia", "Bahamas", "Bahrain","Brunei Darussalam",
            "Belize","Bhutan","Cambodia","Swaziland","Grenada","Jamaica","Japan","Kuwait","Jordan",
            "Lesotho","Malaysia","Morocco","New Zealand","Oman","Papua New Guinea","Qatar","Saint Kitts and Nevis",
            "Saint Lucia","Saudi Arabia","Solomon Islands","Thailand","Tonga","Tuvalu","United Arab Emirates")

Map = joinCountryData2Map(DF,
                          joinCode = "ISO3",
                          nameJoinColumn ="q",
                          mapResolution = "coarse")

mapParams = mapCountryData(Map,
                           nameColumnToPlot = "Assignment",
                           catMethod = "categorical",
                           missingCountryCol = gray(.4))

country_coord <- data.frame(coordinates(Map))[country, ]

text(x = country_coord$X1,
     y = country_coord$X2,
     labels = row.names(country_coord),
     adj = NULL, pos = 3,  offset = 0, vfont = NULL,
cex = 0.3, col = "blue", font = 5)回答 1
Stack Overflow用户
回答已采纳
发布于 2021-05-17 09:34:01
答案
基本text函数不具有此功能。您可能需要依赖其他包来实现您想要的结果:
- 找到一个处理基本图形的包,比如basicPlotteR。
- 切换到使用
ggplot2::ggplot绘图,并使用ggrepel::geom_text_repel或ggrepel::geom_label_repel。
basicPlotteR::addTextLabels 1.
给定一些设置,它将取代文本,并使用行指示文本属于哪个国家。
# remotes::install_github("JosephCrispell/basicPlotteR")
library(basicPlotteR)

# replace text() with this
addTextLabels(x = country_coord$X1, y = country_coord$X2, labels = row.names(country_coord), cex.label = 0.3, col.label = "blue")
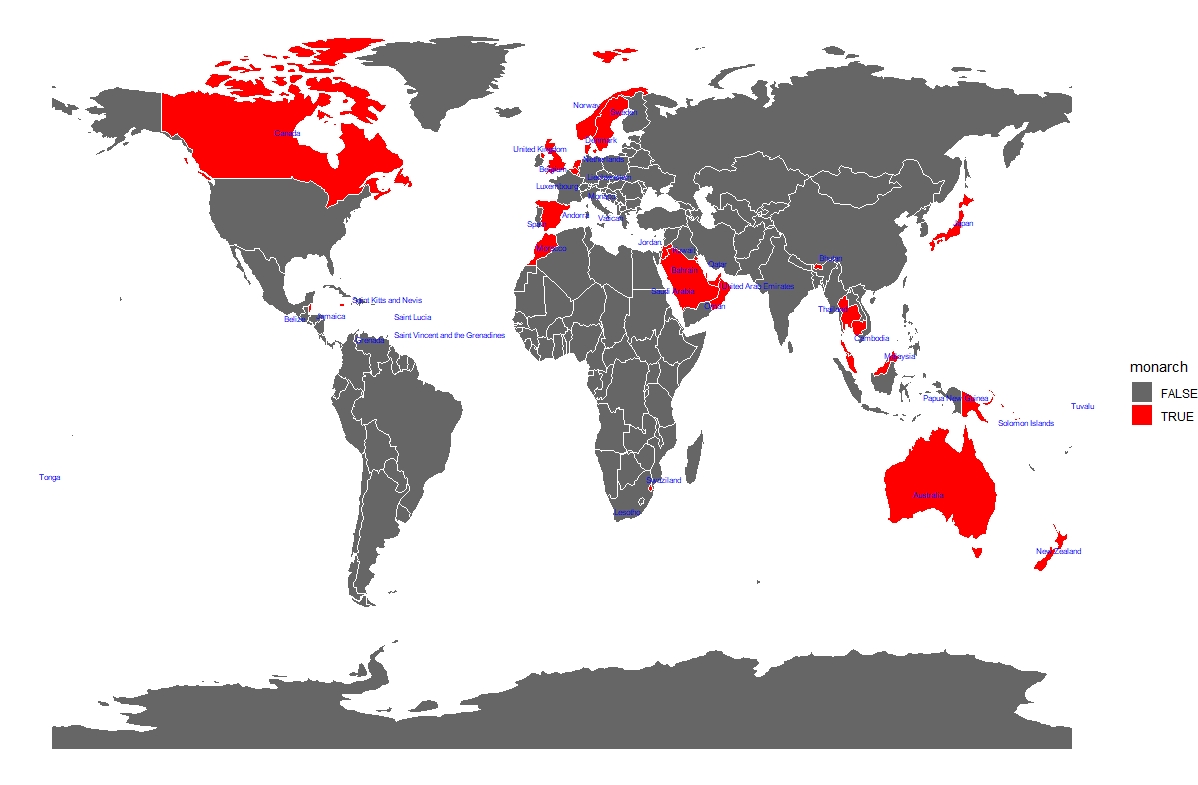
ggrepel::geom_text_repel 2.
这将做同样的事情,但有更多的定制选项。请注意,如果geom_text_repel (和geom_label_repel)不能在您的需求中绘制它们,它们将删除标签。
library(ggplot2)
library(ggrepel)

mymap <- fortify(Map)
mymap$monarch <- mymap$id %in% country

ggplot(data = mymap, aes(x = long, y = lat)) +
  theme_void() +
  geom_map(map = mymap,
           aes(group = group, map_id = id,
               fill = monarch),
           color = "#ffffff") +
  scale_fill_manual(values = c("#666666", "#FF0000")) +
  ggrepel::geom_text_repel(data = country_coord,
                           aes(x = X1, y = X2),
                           label = row.names(country_coord),
                           size = 2,
                           col = "blue")
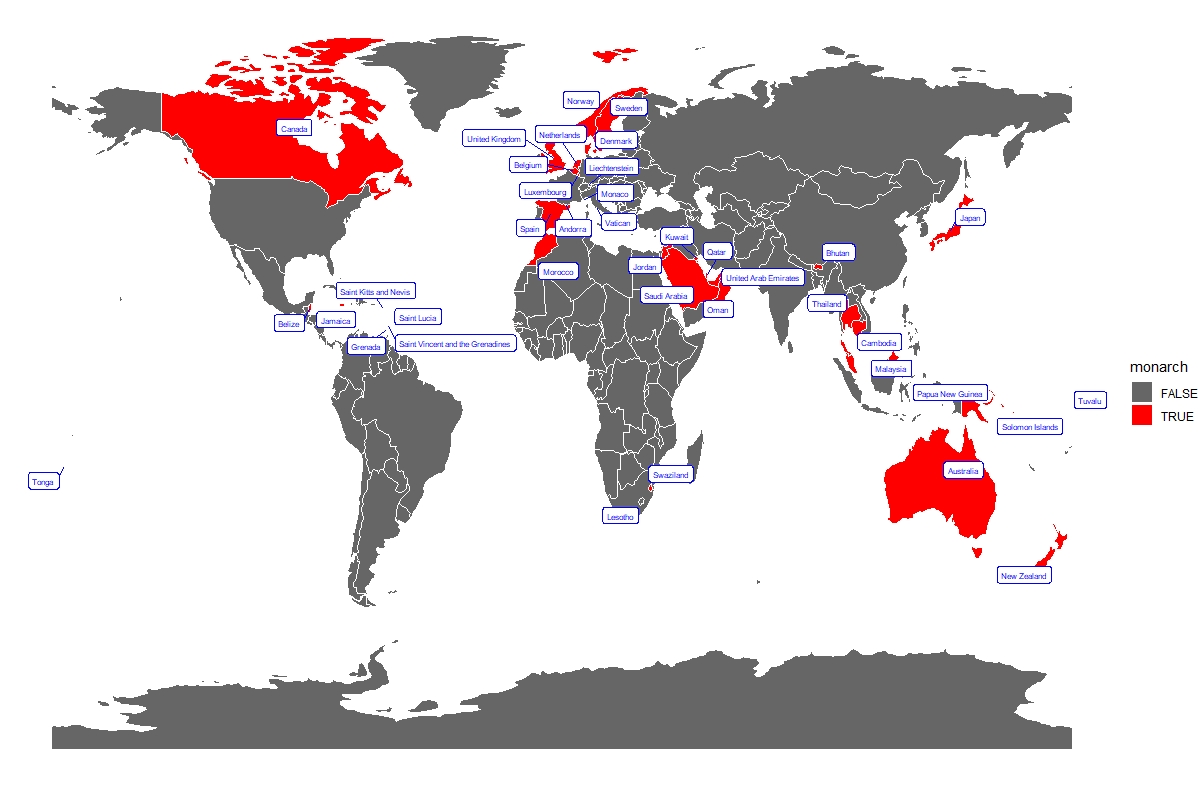
ggrepel::geom_label_repel 3.
这将类似于geom_text_repel (也可以删除不符合要求的标签),但是文本周围会有一个很好的框。
ggplot(data = mymap, aes(x = long, y = lat)) +
  theme_void() +
  geom_map(map = mymap,
           aes(group = group, map_id = id,
               fill = monarch),
           color = "#ffffff") +
  scale_fill_manual(values = c("#666666", "#FF0000")) +
  ggrepel::geom_label_repel(data = country_coord,
                           aes(x = X1, y = X2),
                           label = row.names(country_coord),
                           size = 2,
                           col = "blue")
页面原文内容由Stack Overflow提供。腾讯云小微IT领域专用引擎提供翻译支持
原文链接:
https://stackoverflow.com/questions/67566460
复制相关文章
相似问题
腾讯云开发者

Copyright © 2013 - 2026 Tencent Cloud. All Rights Reserved. 腾讯云 版权所有
深圳市腾讯计算机系统有限公司 ICP备案/许可证号:粤B2-20090059 ![]() 粤公网安备44030502008569号
粤公网安备44030502008569号
腾讯云计算(北京)有限责任公司 京ICP证150476号 | 京ICP备11018762号