
如何在图9中将geom_text标签放置在地块边界之外
使用折线,我试图绘制线段,并注释每个片段在右边的情节。我是跟随的例子在平面图在线文件,但右边的文本是截止。如果我使用ha='right',我可以显示文本,但这不是我想要的,它会将文本移动到情节中。我也尝试过添加+ theme(subplots_adjust={'right': 2}),但这只会扩大情节的宽度,而不包括文本。
请注意,我不想手动指定x位置,因为我的数据文件中的x值的范围会有所不同,我需要在脚本中绘制许多情节。虽然能够使用一些plot9函数获得xlimits并将它们传递到x位置,但我不知道如何做到这一点。
更好的办法是把文字放在情节范围之外。
我的问题是:有没有办法将geom_text()文本从情节的主框中放出来,在右边的边缘(也在左边)?我怎样才能做到这一点?
下面提供了一个代码示例。
from plotnine import *
from plotnine.data import mtcars
import numpy as np

mtcars_plot_df = mtcars[:20]
mtcars_plot_df.loc[:, 'wt_l'] = mtcars_plot_df['wt'] - np.random.uniform(1)
mtcars_plot_df.loc[:, 'wt_h'] = mtcars_plot_df['wt'] + np.random.uniform(1)
mtcars_plot_df.loc[:, 'wt_str'] = mtcars_plot_df['wt'].round(2).astype(str) + ' (' + mtcars_plot_df['wt_l'].round(2).astype(str) + ' - ' + mtcars_plot_df['wt_h'].round(2).astype(str) + ')'

nrows = mtcars_plot_df.shape[0] * 0.2

(ggplot()
 # Range strip
 + geom_segment(
     mtcars_plot_df,
     aes(x='wt_l', xend='wt_h', y='name', yend='name'),
     size=1,
     color='red'
 )
 # Point markers
 + geom_point(
     mtcars_plot_df,
     aes('wt', 'name'),
     size=1.5,
     stroke=0.7,
     color='blue'
 )
 # Range label
 + geom_text(
     # mtcars_plot_df, => This generates error
     aes(x=np.inf, y='name', label="wt_str"),
     data = mtcars_plot_df, # => This gets rid of the error
     size=8,
     ha='left'
 )
 + theme(figure_size=(4, nrows*1))  # here you define the plot size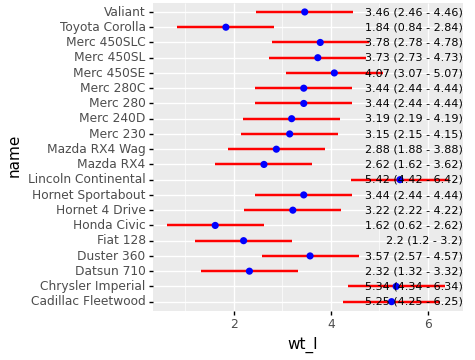
)当我在ha='right'中使用geom_text()时,我得到一个如所附图像所示的图。正如你所看到的,文本干扰了情节。当我使用ha='left'时,文本是不可见的。我希望文本在情节区域之外,在图的右边的白色区域,类似于车名是如何打印在图的左边。
我在下面的文章中遇到的一个附带的问题是:如果我没有在data = mtcars_plot_df行之后将dataframe指定为aes,那么我就得到了这个错误:ValueError: The truth value of a DataFrame is ambiguous. Use a.empty, a.bool(), a.item(), a.any() or a.all()。请参阅上面代码中的两个注释。
回答 1
Stack Overflow用户
发布于 2021-12-04 03:19:37
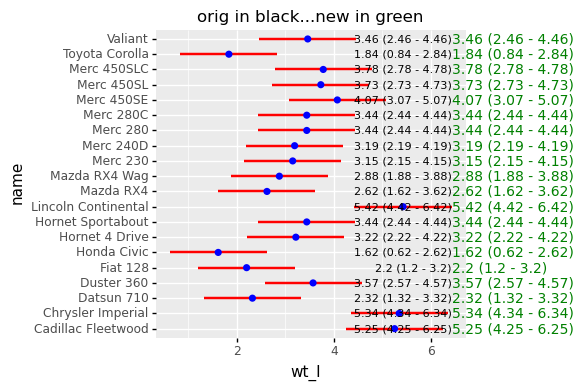
这是旧的,但是您可以使用ggplot对象的draw方法返回matplotlib对象,并使用matplotlib ax.text方法来绘制注释。
p = (ggplot()
 # Range strip
 + geom_segment(
     mtcars_plot_df,
     aes(x='wt_l', xend='wt_h', y='name', yend='name'),
     size=1,
     color='red'
 )
 # Point markers
 + geom_point(
     mtcars_plot_df,
     aes('wt', 'name'),
     size=1.5,
     stroke=0.7,
     color='blue'
 )
 # Range label
 + geom_text(
     # mtcars_plot_df, => This generates error
     aes(x=np.inf, y='name', label="wt_str"),
     data = mtcars_plot_df, # => This gets rid of the error
     size=8,
     ha='right'
 )
 + theme(figure_size=(4, nrows*1))  # here you define the plot size
)

fig = p.draw()
# get the figure axis
ax = fig.axes[0]
# info for where to draw the annotations
far_right_x = mtcars_plot_df['wt_h'].max()
y_tick_labels = list(ax.get_yticklabels())
# loop through the y labels and plot the text at right location
for y_tick in y_tick_labels:
    y_text = y_tick.get_text()
    y_loc = y_tick.get_position()[1]
    ax.text(far_right_x,y_loc,
            mtcars_plot_df.loc[mtcars_plot_df['name']==y_text,'wt_str'].values[0],
            ha='left',va='center',color='green')
plt.title("orig in black...new in green")
你可以看到原来的黑色文本和绿色的新文本。
关于您的侧问题,当移除或放置data=行在aes之上时,我不会遇到这个错误。但是,由于没有在ggplot构造函数中定义数据,所以需要在调用的所有geom_*中提供数据。
https://stackoverflow.com/questions/67625992
复制相似问题
腾讯云开发者

Copyright © 2013 - 2026 Tencent Cloud. All Rights Reserved. 腾讯云 版权所有
深圳市腾讯计算机系统有限公司 ICP备案/许可证号:粤B2-20090059 ![]() 粤公网安备44030502008569号
粤公网安备44030502008569号
腾讯云计算(北京)有限责任公司 京ICP证150476号 | 京ICP备11018762号