
如何创建显示Ct扫描Makie.jl的朱莉娅彩色方案
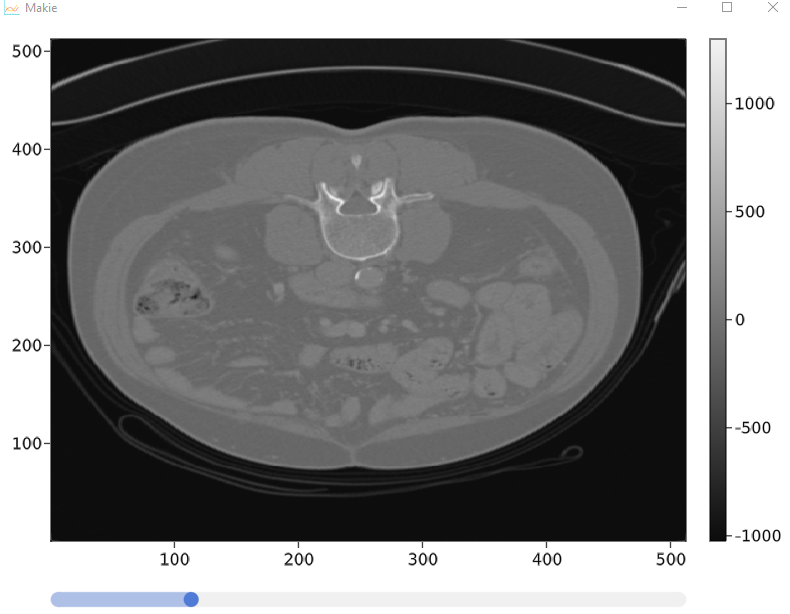
我使用makie.jl和slicesNumb进行PET/CT扫描的可视化,我有三维衰减值阵列,我用滑块显示热图和改变切片--这很好,我有两个问题。
- 我不知道如何定义自定义的渐变值(基本上,我需要能够指定以上所有阈值都是黑色的,所有阈值都是白色的,两者之间的值与衰减值成正比)。
2)我希望能够在我的图像(热图)上显示另一个我可以控制透明度-像素的α值,以显示一些注解/ PET .
可以工作但没有这两个功能的代码以及它的外观
using GLMakie

```@doc
单幅图像在横向平面上的简单显示
function singleCtScanDisplay(arr ::Array{Number, 3})


  fig = Figure()
  sl_x = Slider(fig[2, 1], range = 1:1:size(arr)[3], startvalue = 40)
  ax = Axis(fig[1, 1])
  hm = heatmap!(ax, lift(idx-> arr[:,:, floor(idx)], sl_x.value) ,colormap = :grays)
  Colorbar(fig[1, 2], hm)


  fig

end
谢谢你帮忙!
回答 2
Stack Overflow用户
发布于 2021-05-29 22:20:55
您可以使用Colors和ColorSchemeTools,但是您需要根据您的阈值添加方案的顶部和底部。
using Colors, ColorSchemeTools

truemin = 0
truemax = 600
max_shown_black = 20
min_shown_white = 500

data = rand(truemin:truemax, (500, 500, 20))

grayscheme =  [fill(colorant"black", max_shown_black - truemin + 1);
               collect(make_colorscheme(identity, identity, identity,
                   length = min_shown_white - max_shown_black - 1));
               fill(colorant"white", truemax - min_shown_white + 1)]
为了控制alpha,我会添加一个带有alpha滑块的弹出窗口。看看一些可分发的DICOM工具作为例子。
Stack Overflow用户
发布于 2021-06-08 14:55:23
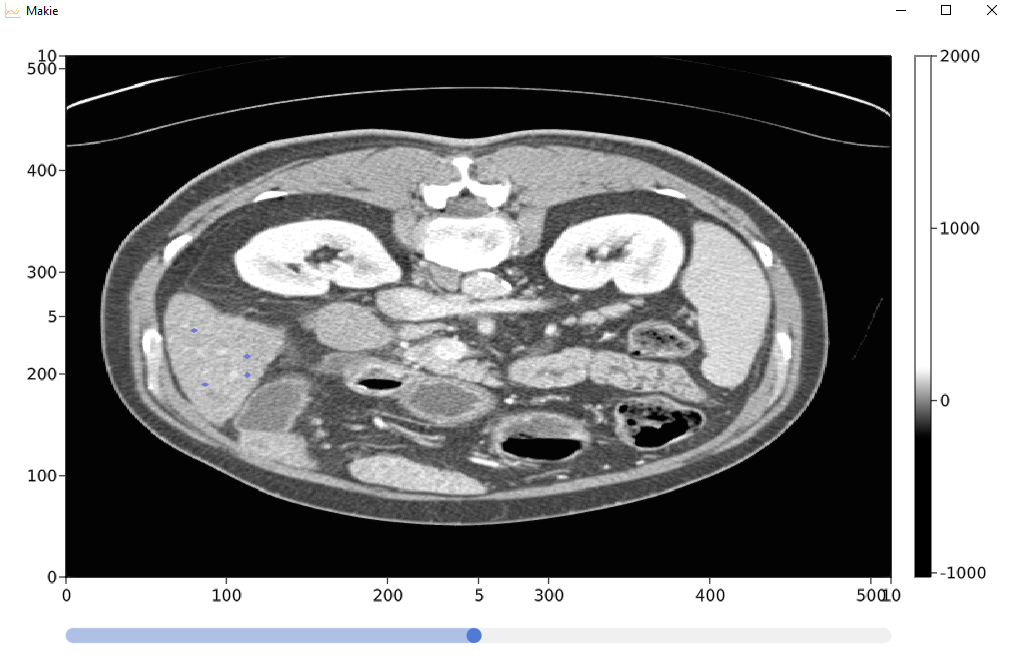
我最终完成了管理,基本上我加载了存储在hdf5中的三维数据(我使用python将它从原始的hdf5中加载到了hdf5中)。
它允许查看横向切片,并在遮罩中注释3d路径,该掩码将显示在主图像上。
exmpleH = @spawnat persistenceWorker Main.h5manag.getExample()
minimumm = -1000
maximumm = 2000
arrr= fetch(exmpleH)
imageDim = size(arrr)
using GLMakie
maskArr = Observable(BitArray(undef, imageDim))
MyImgeViewer.singleCtScanDisplay(arrr, maskArr,minimumm, maximumm)
现在定义所需的模块
```@doc负责显示医学图像数据的功能
using DrWatson
@quickactivate "Probabilistic medical segmentation"


module MyImgeViewer

using GLMakie
using Makie
#using GeometryBasics
using GeometricalPredicates
using ColorTypes
using Distributed
using GLMakie
using Main.imageViewerHelper
using Main.workerNumbers
## getting id of workers

```@doc
仅在横向平面上简单地显示单个图像,我们还添加了一个掩码,
代表医学图像的主要三维数据,例如CT,每个体素代表X射线衰减值。
最小值,最大值--我们可以在图像中得到的大约最小值和最大值。
function singleCtScanDisplay(arrr ::Array{Number, 3}, maskArr , minimumm, maximumm)
#we modify 2 pixels just in order to make the color range constant so slices will be displayed in the same windows
arrr[1,1,:].= minimumm
arrr[2,1,:].= maximumm


imageDim = size(arrr) # dimenstion of the primary image for example CT scan
slicesNumb =imageDim[3] # number of slices

#defining layout variables
scene, layout = GLMakie.layoutscene(resolution = (600, 400))
ax1 = layout[1, 1] = GLMakie.Axis(scene, backgroundcolor = :transparent)
ax2 = layout[1, 1] = GLMakie.Axis(scene, backgroundcolor = :transparent)

#control widgets
sl_x =layout[2, 1]= GLMakie.Slider(scene, range = 1:1: slicesNumb , startvalue = slicesNumb/2 )
sliderXVal = sl_x.value


#color maps
cmwhite = cgrad(range(RGBA(10,10,10,0.01), stop=RGBA(0,0,255,0.4), length=10000));
greyss = createMedicalImageColorSchemeB(200,-200,maximumm, minimumm )
####heatmaps

#main heatmap that holds for example Ct scan
currentSliceMain = GLMakie.@lift(arrr[:,:, convert(Int32,$sliderXVal)])
hm = GLMakie.heatmap!(ax1, currentSliceMain ,colormap = greyss)

#helper heatmap designed to respond to both changes in slider and changes in the bit matrix
currentSliceMask = GLMakie.@lift($maskArr[:,:, convert(Int32,$sliderXVal)])
hmB = GLMakie.heatmap!(ax1, currentSliceMask ,colormap = cmwhite)

#adding ability to be able to add information to mask  where we clicked so in casse of mit matrix we will set the point where we clicked to 1
indicatorC(ax1,imageDim,scene,maskArr,sliderXVal)

#displaying
colorB = layout[1,2]= Colorbar(scene, hm)
GLMakie.translate!(hmB, Vec3f0(0,0,5))

scene

end

```@doc受https://github.com/JuliaPlots/Makie.jl/issues/810启发
总的来说,由于这个功能,查看器能够响应对切片的单击,并将其记录在所提供的三维AbstractArray中。
ax - Axis,它存储我们想要观察的热图切片,用户点击了它们,并在哪里点击了它们。
dims .主要图像的尺寸(例如CT )
我们的轴心所在的sc场景
maskArr -与存储图像的主阵列完全相同的三维位数组
sliceNumb -表示我们当前正在运行的幻灯片--通常它只是从滑块中提供信息。
function indicatorC(ax::Axis,dims::Tuple{Int64, Int64, Int64},sc::Scene,maskArr,sliceNumb::Observable{Any})
  register_interaction!(ax, :indicator) do event::GLMakie.MouseEvent, axis
  if event.type === MouseEventTypes.leftclick
    println("clicked")
    #@async begin
      #appropriately modyfing wanted pixels in mask array
   @async calculateMouseAndSetmaskWrap(maskArr, event,sc,dims,sliceNumb)
    #
    #
    #  println("fetched" + fetch(maskA))

    #  finalize(maskA)
    #end
    return true
    #print("xMouse: $(xMouse)  yMouse: $(yMouse)   compBoxWidth: $(compBoxWidth)  compBoxHeight: $(compBoxHeight)   calculatedXpixel: $(calculatedXpixel)  calculatedYpixel: $(calculatedYpixel)      pixelsNumbInX  $(pixelsNumbInX)         ")
  end

end
end
```@doc
calculateMouseAndSetmask包装器-来自imageViewerHelper模块
给定的鼠标事件相应地修改掩码
maskArr -与存储图像的主阵列完全相同的三维位数组
事件-从Makie传递的鼠标事件
我们在Makie中使用的sc场景
函数calculateMouseAndSetmaskWrap(maskArr,event,sc,dims,sliceNumb)
maskArr[] = calculateMouseAndSetmask(maskArr,event,sc,dims,sliceNumb)
结束
端#模块
and helper methods

```javascriptfunctions responsible for helping in image viewer - those functions are meant to be invoked on separate process
- in parallel使用DrWatson
@quickactivate“概率医学分割”
模块imageViewerHelper
使用文档记录器
使用ColorTypes
使用颜色,ColorSchemeTools
使用Makie
导出calculateMouseAndSetmask
导出createMedicalImageColorSchemeB
使用AbstractPlotting
  given mouse event modifies mask accordingly
  maskArr - the 3 dimensional bit array  that has exactly the same dimensions as main Array storing image
  event - mouse event passed from Makie
  sc - scene we are using in Makie
函数calculateMouseAndSetmask(maskArr,event,sc,dims,sliceNumb)
#左上角的位置
xMouse= Makie.to_world(sc,event.data)1
yMouse= Makie.to_world(sc,event.data)2
#布局中的高度和宽度数据
compBoxWidth = 510
compBoxHeight = 510
#图像尺寸-来自医学图像的像素数,例如ct扫描
pixelsNumbInX =dims1 1
pixelsNumbInY =dims2 2
#计算我们在哪个图像像素上
calculatedXpixel =转换(Int32,圆形((x老鼠/compBoxWidth)pixelsNumbInX))
calculatedYpixel =转换(Int32,圆形((y老鼠/compBoxHeight)pixelsNumbInY ))
sliceNumbConv =转换(Int32,圆形( sliceNumb[] ))
#在掩码阵列中适当地移动想要的像素
返回markMaskArrayPatch( maskArr,CartesianIndex(calculatedXpixel,calculatedYpixel,sliceNumbConv ),2)
端
maskArr -与存储图像的主阵列完全相同的三维位数组
点-笛卡儿坐标点,我们要修改周围的三维数组从0到1。
function markMaskArrayPatch(maskArr, pointCart::CartesianIndex{3}, patchSize ::Int64)

  ones = CartesianIndex(patchSize,patchSize,patchSize) # cartesian 3 dimensional index used for calculations to get range of the cartesian indicis to analyze
  maskArrB = maskArr[]
  for J in (pointCart-ones):(pointCart+ones)
    diff = J - pointCart # diffrence between dimensions relative to point of origin
      if cartesianTolinear(diff) <= patchSize
        maskArrB[J]=1
      end
      end
return maskArrB
end
```@doc
只适用于三维笛卡尔坐标
点的笛卡儿坐标,我们将加入尺寸.
function cartesianTolinear(pointCart::CartesianIndex{3}) :: Int16
   abs(pointCart[1])+ abs(pointCart[2])+abs(pointCart[3])
end

```@doc
为正确显示医学图像(主要是CT扫描)创建灰色方案颜色
min_shown_white - max_shown_black范围,将显示灰度的灰度值。
truemax --在我们要为其创建比例的图像中的值范围。
#taken from https://stackoverflow.com/questions/67727977/how-to-create-julia-color-scheme-for-displaying-ct-scan-makie-jl/67756158#67756158

function createMedicalImageColorSchemeB(min_shown_white,max_shown_black,truemax,truemin ) ::Vector{Any}
# println("max_shown_black - truemin + 1")
# println(max_shown_black - truemin + 1)
# println(" min_shown_white - max_shown_black - 1")
# println( min_shown_white - max_shown_black - 1)
# println("truemax - min_shown_white + 1")
# println(truemax - min_shown_white + 1)

return  [fill(colorant"black", max_shown_black - truemin + 1);
               collect(make_colorscheme(identity, identity, identity,
                   length = min_shown_white - max_shown_black - 1));
               fill(colorant"white", truemax - min_shown_white + 1)]

end


end #module
https://stackoverflow.com/questions/67727977
复制相似问题
腾讯云开发者

Copyright © 2013 - 2026 Tencent Cloud. All Rights Reserved. 腾讯云 版权所有
深圳市腾讯计算机系统有限公司 ICP备案/许可证号:粤B2-20090059 ![]() 粤公网安备44030502008569号
粤公网安备44030502008569号
腾讯云计算(北京)有限责任公司 京ICP证150476号 | 京ICP备11018762号