
R闪亮错误:无法访问反应性消费者之外的反应性值“select_food”
R闪亮错误:无法访问反应性消费者之外的反应性值“select_food”
提问于 2021-06-01 14:01:18
首先,我知道这个问题已经问过了,但答案帮不了我。
我的问题是:我正在编写一个小应用程序,根据几个输入绘制一个堆栈条形图。问题是输入2和3取决于第一个输入。
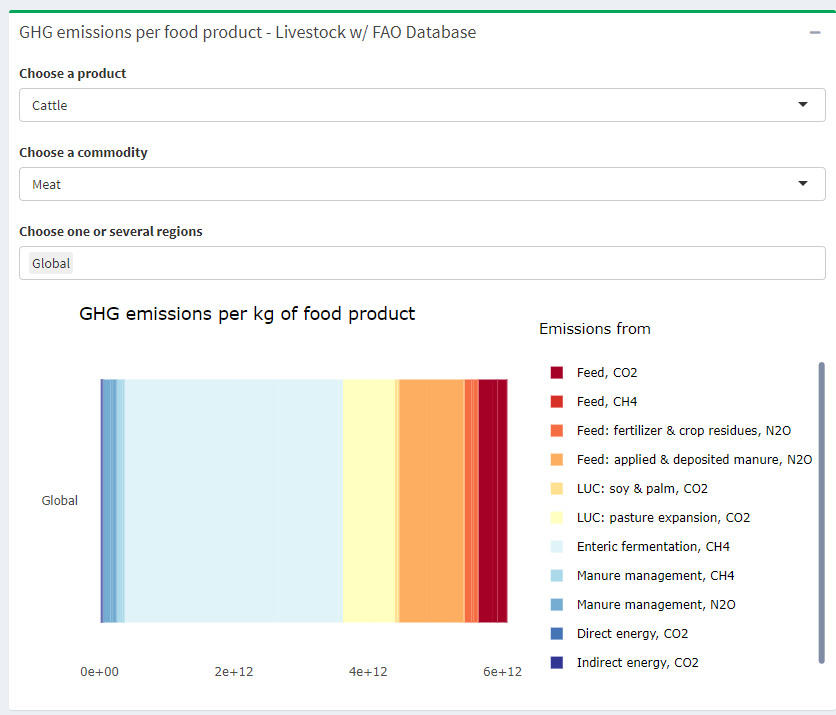
我正在使用粮农组织的数据集(你可以在这里找到它:http://www.fao.org/gleam/results/en/#top),在这里你可以选择动物物种(牛、猪、鸡、.)然后,根据你选择的动物,你可以选择一种商品(肉类,乳制品,鸡蛋,.)和世界上的一个地区。下面是数据集的一个dput:
structure(list(Region = c("Global", "Global", "Global", "Global",
"Global", "Global"), `Animal species` = c("Cattle", "Cattle",
"Cattle", "Cattle", "Cattle", "Cattle"), `Production system` = c("Aggregated",
"Aggregated", "Aggregated", "Grassland systems", "Grassland systems",
"Grassland systems"), Commodity = c("Aggregated", "Milk", "Meat",
"Aggregated", "Milk", "Meat"), `Emission intensity` = c(160.292607757249,
86.7289320197207, 295.375059643258, 206.327939471892, 94.9887978082703,
433.778095712786), Production = c(29163104087.7766, 18880885304,
10282218783.7766, 10338174726.3435, 6940654475.5, 3397520250.84346
), `Total GHG emissions` = c(4674630004525.8, 1637519018002.76,
3037110986523.04, 2133054289186.84, 659284424630.336, 1473769864556.5
), `Total CO2 emissions` = c(944929928440.176, 275691406265.277,
669238522174.899, 562806229576.7, 92861399862.2565, 469944829714.444
), `Total CH4 emissions` = c(2648727469345.78, 967644226877.794,
1681083242467.99, 1052965148816.85, 371346057784.129, 681619091032.719
), `Total N2O emissions` = c(1080972606739.85, 394183384859.689,
686789221880.157, 517282910793.29, 195076966983.95, 322205943809.34
), `Feed, CO2` = c(353472898876.963, 138234019318.282, 215238879558.681,
111398227143.195, 44040030065.8682, 67358197077.3266), `Feed, CH4` = c(0,
0, 0, 0, 0, 0), `Feed: fertilizer & crop residues, N2O` = c(174073200018.734,
71662075640.6952, 102411124378.039, 52536600648.293, 21561262083.5362,
30975338564.7568), `Feed: applied & deposited manure, N2O` = c(741986436762.08,
254388527100.44, 487597909661.64, 426761235035.348, 158783824942.446,
267977410092.903), `LUC: soy & palm, CO2` = c(46879544227.8534,
14974206675.1606, 31905337552.6928, 8194329546.5076, 2412100065.64785,
5782229480.85975), `LUC: pasture expansion, CO2` = c(387006214285.714,
0, 387006214285.714, 387006214285.714, 0, 387006214285.714),
    `Enteric fermentation, CH4` = c(2509275304012.47, 885635162795.57,
    1623640141216.9, 996909632562.869, 336901779434.28, 660007853128.589
    ), `Manure management, CH4` = c(139452165333.309, 82009064082.2245,
    57443101251.0844, 56055516253.9789, 34444278349.8494, 21611237904.1294
    ), `Manure management, N2O` = c(164912969959.032, 68132782118.5531,
    96780187840.4786, 37985075109.6489, 14731879957.9685, 23253195151.6804
    ), `Direct energy, CO2` = c(42155419009.351, 29934851370.7,
    12220567638.651, 14173264181.2837, 10786045291.1, 3387218890.18368
    ), `Indirect energy, CO2` = c(15856531895.5915, 3252888569.33446,
    12603643326.2571, 4303271766.469, 999843540.840469, 3303428225.62853
    ), `Postfarm, CO2` = c(99559320144.7024, 89295440331.8, 10263879812.9024,
    37730922653.5311, 34623380898.8, 3107541754.7311)), row.names = c(NA,
-6L), class = c("tbl_df", "tbl", "data.frame"))当我只使用三个selectInput运行我的代码时,它都能工作,但是当我试图运行这个情节时,不幸的是,它不再起作用了。我总是会犯错误:
错误:无法访问反应性使用者之外的反应性值“select_food”。
这是我的密码:
body <- dashboardBody(

  useShinyjs(),

  #tags$head(tags$style(HTML('.small-box .icon-large {top: 5px;}'))),

  tabItems(
    ################################### AGRI ###########################
    tabItem("agri",
            fluidRow(

              box(title="GHG emissions per food product - Livestock w/ FAO Database",status="success",solidHeader = FALSE, collapsible = TRUE,
                                                                                                                uiOutput("select_food"),
                  uiOutput("secondSelection"),
                  uiOutput("region"),
                  plotlyOutput("ghg_food"),
                  width = 12)
            )
    )
  )

)

ui <- dashboardPage(header, sidebar, body, skin = skin)
对于服务器部分:
server <- function(input, output) {

  output$select_food <- renderUI({
    selectInput("select_food", "Choose a product",
                choices = unique(gleam$`Animal species`),
                multiple = FALSE,
                selected = "Cattle")

  })

  output$secondSelection <- renderUI({
    if (!is.null(input$select_food)){
      data_input <- reactive({input$select_food})
      selectInput("commodity", "Choose a commodity", choices = as.character(unique(gleam[gleam$`Animal species` == data_input(),]$Commodity)), multiple = FALSE, selected = "Meat")
    }
  })

  output$region <- renderUI({
    if (!is.null(input$select_food) & !is.null(input$commodity)){
      data_input2 <- reactive({input$commodity})
      data_input <- reactive({input$select_food})
      selectInput("region", "Choose one or several regions", choices = as.character(unique(gleam[(gleam$`Animal species` == data_input()) & (gleam$Commodity == data_input2()),]$Region)), multiple = TRUE, selected = "Global")
    }
  })


  output$ghg_food <- plotlyOutput({

    if (!is.null(input$select_food)){
     data_input <- reactive({input$select_food})
     data_input_food <- data_input()
    }
    if (!is.null(input$commodity)){
      data_input2 <- reactive({input$commodity})
      data_input2_commo <- data_input2
    }
    if (!is.null(input$region)){
      data_input3 <- reactive({input$region})
      data_input3_reg <- data_input3()
    }

    chosen_animal <- data_input_food
    chosen_commodity <- data_input2_commo
    chosen_reg <- data_input3_reg

    animal_commo <- gleam %>%
      filter(`Animal species` == chosen_animal, Commodity == chosen_commodity, Region %in% chosen_reg)

    decomp <- animal_commo %>%
      select(-c('Emission intensity', 'Production', 'Total GHG emissions', 'Total CO2 emissions', 'Total CH4 emissions', 'Total N2O emissions', 'Animal species', 'Production system', 'Commodity'))

    df_decomp <- melt(decomp, id.var="Region")

    ggplotly(
      ggplot(df_decomp, aes(x = reorder(Region, value, sum), y = value, fill = variable)) +
        geom_bar(stat = "identity") +
        theme_minimal() +
        ylab("") +
        xlab("") +
        labs(fill='Emissions from ') +
        ggtitle("GHG emissions per kg of food product") +
        scale_fill_brewer(palette="RdYlBu") +
        coord_flip() +
        theme(panel.grid.major = element_blank(), panel.grid.minor = element_blank(), legend.position="bottom") ,
      tooltip = c("x", "fill")
    )

  })

}

shinyApp(ui = ui, server = server)
我不明白反应性的需要,也不明白为什么我的代码不能工作。
回答 1
Stack Overflow用户
发布于 2021-06-01 16:12:39
您的错误主要是因为在定义plotlyOutput时使用了renderPlotly而不是renderPlotly。您可以通过在renderUI之外定义数据来简化它。虽然有些步骤是多余的,因为用例可能不一样,但我仍然保留了流。尝尝这个
server <- function(input, output, session) {

  output$selectfood <- renderUI({
    selectInput("select_food", "Choose a product",
                choices = unique(gleam$`Animal species`),
                multiple = FALSE,
                selected = "Cattle")

  })

  data_input <- reactive({
    req(input$select_food)
    input$select_food
  })

  output$secondSelection <- renderUI({
    req(input$select_food)
    if (!is.null(input$select_food)){

      selectInput("commodity", "Choose a commodity", choices = as.character(unique(gleam[gleam$`Animal species` == input$select_food,]$Commodity)), multiple = FALSE, selected = "Meat")
    }
  })

  data_input2 <- reactive({
    req(input$commodity)
    input$commodity
  })

  output$region <- renderUI({
    if (!is.null(input$select_food) & !is.null(input$commodity)){

      #data_input <- reactive({input$select_food})
      selectInput("region", "Choose one or several regions", choices = as.character(unique(gleam[(gleam$`Animal species` == data_input()) & (gleam$Commodity == data_input2()),]$Region)), multiple = TRUE, selected = "Global")
    }
  })

  data_input3 <- reactive({
    req(input$region)
    input$region
  })

  df_decomp <- reactive({
    req(data_input(),data_input2(),data_input3())
    if (!is.null(input$select_food)){
      #data_input <- reactive({input$select_food})
      data_input_food <- data_input()
    }
    if (!is.null(input$commodity)){
      #data_input2 <- reactive({input$commodity})
      data_input2_commo <- data_input2()
    }
    if (!is.null(input$region)){
      #data_input3 <- reactive({input$region})
      data_input3_reg <- data_input3()
    }

    chosen_animal <- data_input_food
    chosen_commodity <- data_input2_commo
    chosen_reg <- data_input3_reg

    animal_commo <- gleam %>%
      filter(`Animal species` == chosen_animal, Commodity == chosen_commodity, Region %in% chosen_reg)

    decomp <- animal_commo %>%
      select(-c('Emission intensity', 'Production', 'Total GHG emissions', 'Total CO2 emissions', 'Total CH4 emissions', 'Total N2O emissions', 'Animal species', 'Production system', 'Commodity'))

    df <- melt(decomp, id.var="Region")
    df
  })


  output$ghg_food <- renderPlotly({
    req(df_decomp())

    ggplotly(
      ggplot(df_decomp(), aes(x = reorder(Region, value, sum), y = value, fill = variable)) +
        geom_bar(stat = "identity") +
        theme_minimal() +
        ylab("") +
        xlab("") +
        labs(fill='Emissions from ') +
        ggtitle("GHG emissions per kg of food product") +
        scale_fill_brewer(palette="RdYlBu") +
        coord_flip() +
        theme(panel.grid.major = element_blank(), panel.grid.minor = element_blank(), legend.position="bottom"),
      tooltip = c("x", "fill")
    )

  })

}

shinyApp(ui = ui, server = server)
页面原文内容由Stack Overflow提供。腾讯云小微IT领域专用引擎提供翻译支持
原文链接:
https://stackoverflow.com/questions/67790279
复制相关文章
相似问题
腾讯云开发者

Copyright © 2013 - 2026 Tencent Cloud. All Rights Reserved. 腾讯云 版权所有
深圳市腾讯计算机系统有限公司 ICP备案/许可证号:粤B2-20090059 ![]() 粤公网安备44030502008569号
粤公网安备44030502008569号
腾讯云计算(北京)有限责任公司 京ICP证150476号 | 京ICP备11018762号