
geom_dotplot填充美学变更数据分组
geom_dotplot填充美学变更数据分组
提问于 2021-06-06 22:51:12
在geom_dotplot中添加一个fill变量会在geom中引入一个不需要的分组。以下是不添加填充变量时的行为:
library(tidyverse)

mtcars %>%
 ggplot(
   aes(
     factor(vs), mpg
   )
 ) +
 geom_dotplot(
   stackdir = "center",
   binaxis = "y",
   fill = "white"
 ) +
 coord_flip()
返回
我只是想给一些点涂上颜色,以便引起注意,但我不想让这些点改变位置。如果我试图影响填充如下:
mtcars %>%
  rownames_to_column %>%
  mutate(
    merc = rowname %>%
      str_detect("Merc ") %>%
      as.numeric %>%
      factor
  ) %>%
  ggplot(
    aes(
      factor(vs), mpg, fill = merc
    )
  ) +
  geom_dotplot(
    stackdir = "center",
    binaxis = "y",
  ) +
  coord_flip() +
  theme(
    legend.position = "none"
  )
返回
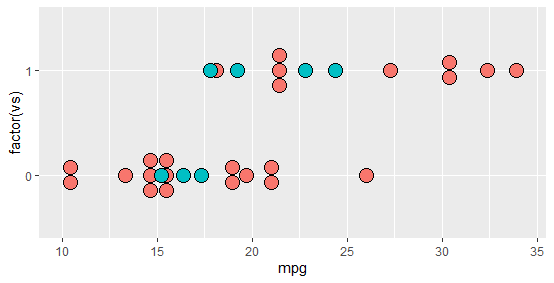
我希望这些圆点保持在第一个情节中的位置,但引入填充美学。这在geom_dotplot中有可能吗?
回答 1
Stack Overflow用户
回答已采纳
发布于 2021-06-07 03:01:16
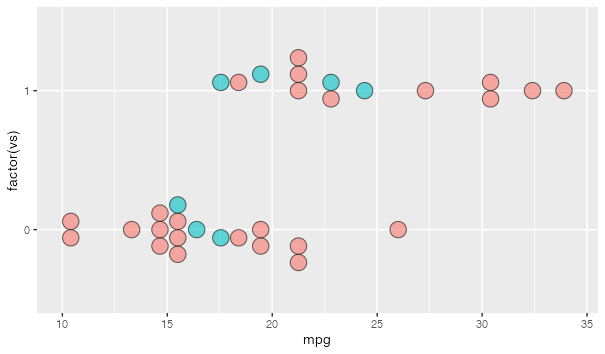
在这里,两个geom_dotplot选项可能很有用:
二值
当方法是"dotdensity“时,"bygroup”(默认)分别确定每个组的回收箱的位置。" all“与所有数据一起确定垃圾箱的位置;这用于对齐多个组中的点堆栈。
堆栈群
应该跨组堆放点吗?这有一个位置=“堆栈”应该具有的效果,但不能(因为这个geom有一些奇怪的属性)。
... + geom_dotplot(alpha = 0.6,   # for testing to show overplotting - none here
                   binpositions = "all",
                   stackgroups = TRUE,  # to avoid overplotting
                   stackdir = "center",
                   binaxis = "y",
      )
页面原文内容由Stack Overflow提供。腾讯云小微IT领域专用引擎提供翻译支持
原文链接:
https://stackoverflow.com/questions/67864275
复制相关文章
相似问题
腾讯云开发者

Copyright © 2013 - 2026 Tencent Cloud. All Rights Reserved. 腾讯云 版权所有
深圳市腾讯计算机系统有限公司 ICP备案/许可证号:粤B2-20090059 ![]() 粤公网安备44030502008569号
粤公网安备44030502008569号
腾讯云计算(北京)有限责任公司 京ICP证150476号 | 京ICP备11018762号