
如何放大到cartopy.crs.Orthographic中的特定纬度?
如何放大到cartopy.crs.Orthographic中的特定纬度?
提问于 2021-06-07 19:21:06
我不确定这是否可能,但我实际上是试图将北冰洋圈纬度(60N)孤立在一张正射地图上,并保持椭球体,而不是让放大后的图像是一个矩形/方形。
以下是我所拥有的:
fig = plt.figure(figsize=[20, 10])

ax1 = plt.subplot(1, 1, 1, projection=ccrs.Orthographic(0, 90))

for ax in [ax1]:
    ax.coastlines(zorder=2)
    ax.stock_img()
    ax.gridlines()
这给了我想要的北极景观,但我想让它停在北纬60度。
回答 1
Stack Overflow用户
回答已采纳
发布于 2021-06-07 21:24:28
要获得正射地图的缩放和平方范围,您需要绘制一些控制点(例如,用.scatter ),或者在投影坐标中指定正确的extent (更困难)。这是要尝试的代码。
import cartopy
import cartopy.crs as ccrs
import matplotlib.pyplot as plt

fig = plt.figure(figsize=[8, 8])

lonlatproj = ccrs.PlateCarree()
my_projn = ccrs.Orthographic(central_longitude=0,central_latitude=90)

ax1 = plt.subplot(1, 1, 1, projection=my_projn)

# set `lowlat` as lower limits of latitude to plot some points
# these points will determine the plot extents of the map
lowlat = 60 + 2.8   # and get 60
lons, lats = [-180,-90,0,90], [lowlat,lowlat,lowlat,lowlat]
# plot invisible points to get map extents
ax1.scatter(lons, lats, s=0, color='r', transform=lonlatproj)
#ax1.stock_img()  #uncomment to get it plotted
ax1.coastlines(lw=0.5, zorder=2)
ax1.gridlines(lw=2, ec='black', draw_labels=True)

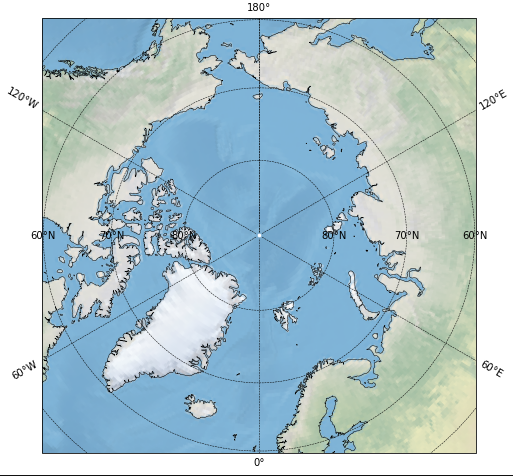
方法2:在投影坐标中指定正确的范围
import cartopy
import cartopy.crs as ccrs
import matplotlib.pyplot as plt

fig = plt.figure(figsize=[8, 8])

lonlatproj = ccrs.PlateCarree()
my_projn = ccrs.Orthographic(central_longitude=0,central_latitude=90)

ax1 = plt.subplot(1, 1, 1, projection=my_projn)

# These 2 lines of code grab extents in projection coordinates
_, y_min = my_projn.transform_point(0, 60, lonlatproj)  #(0.0, -3189068.5)
x_max, _ = my_projn.transform_point(90, 60, lonlatproj) #(3189068.5, 0)

# prep extents of the axis to plot map
pad = 25000
xmin,xmax,ymin,ymax = y_min-pad, x_max+pad, y_min-pad, x_max+pad
# set extents with prepped values
ax1.set_extent([xmin,xmax,ymin,ymax], crs=my_projn) # data/projection coordinates

ax1.stock_img()
ax1.coastlines(lw=0.5, zorder=2)

# plot other layers of data here using proper values of zorder

# finally, plot gridlines
ax1.gridlines(draw_labels=True, x_inline=False, y_inline=True,
              color='k', linestyle='dashed', linewidth=0.5)
plt.show()
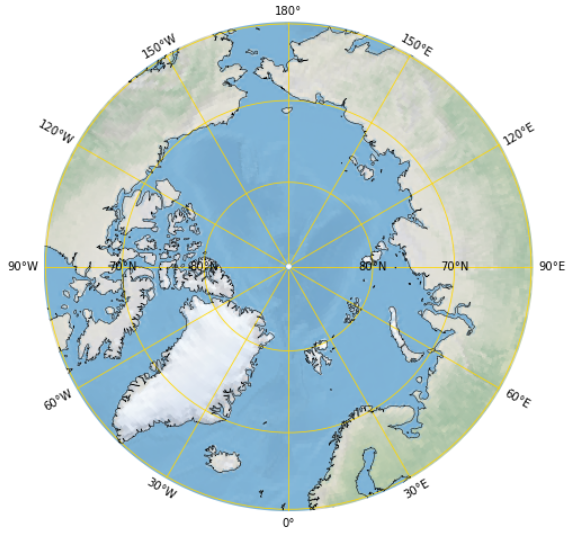
方法3绘制圆边界映射
可运行的代码:
import cartopy.crs as ccrs
import matplotlib.pyplot as plt
import matplotlib.path as mpath
import numpy as np

r_limit = 3214068.5 #from: ax.get_ylim() of above plot

# some settings
lonlatproj = ccrs.PlateCarree()
my_projn = ccrs.Orthographic(central_longitude=0, central_latitude=90)
fig = plt.figure(figsize=[8, 8])
ax = plt.subplot(1, 1, 1, projection=my_projn)

# add bluemarble image
ax.stock_img()
# add coastlines
ax.coastlines(lw=0.5, color="black", zorder=20)


# draw graticule (of meridian and parallel lines)
gls = ax.gridlines(draw_labels=True, crs=ccrs.PlateCarree(), lw=3, color="gold",
        y_inline=True, xlocs=range(-180,180,30), ylocs=range(-80,91,10))


# add extra padding to the plot extents
r_extent = r_limit*1.0001
ax.set_xlim(-r_extent, r_extent)
ax.set_ylim(-r_extent, r_extent)


# Prep circular boundary
circle_path = mpath.Path.unit_circle()
circle_path = mpath.Path(circle_path.vertices.copy() * r_limit,
                           circle_path.codes.copy())

#set circle boundary
ax.set_boundary(circle_path)
#hide frame
ax.set_frame_on(False)  #hide the rectangle frame

plt.show()
页面原文内容由Stack Overflow提供。腾讯云小微IT领域专用引擎提供翻译支持
原文链接:
https://stackoverflow.com/questions/67877552
复制相关文章
相似问题
腾讯云开发者

Copyright © 2013 - 2026 Tencent Cloud. All Rights Reserved. 腾讯云 版权所有
深圳市腾讯计算机系统有限公司 ICP备案/许可证号:粤B2-20090059 ![]() 粤公网安备44030502008569号
粤公网安备44030502008569号
腾讯云计算(北京)有限责任公司 京ICP证150476号 | 京ICP备11018762号